TL;DR Summary: In 2025, B2B inbox placement fell sharply—especially on Microsoft (Office365/Outlook). The biggest drivers: weak authentication (few enforce DMARC), penalties on very high senders (1M+/mo), and new-domain distrust. Organizations with full SPF, DKIM, and DMARC enforcement plus aged domains consistently achieve 85–95% inbox placement.
Executive Summary
Top 5 stats:
- Office365 inbox placement down 26.7 pp YoY; Outlook/Hotmail down 22.6 pp.
- Only 7.6% of domains enforce DMARC.
- 1M+ senders dropped to ~27% inbox placement.
- New domains: ≈30 pp penalty vs mature.
- Full auth + warmup restores 85–95% inbox placement.
B2B email deliverability in 2025 faces unprecedented challenges. While overall email delivery rate remains strong at 98.16%, inbox placement rates have collapsed year-over-year across all major platforms. To address this, we typically begin with a structured Digital Marketing Audit, where we map sender infrastructure, domain reputation, authentication status, and mailbox provider routing behavior. This establishes a clear diagnostic baseline before optimization. Email service providers experienced dramatic declines: Mailgun fell 27.75 percentage points (53.80% to 26.05%), MailChimp dropped 19.63 points (51.93% to 32.30%), and Amazon SES declined 14.60 points (54.90% to 40.30%). Microsoft-owned platforms performed worst, with Office365 down 26.73 points (77.43% to 50.70%) and Outlook/Hotmail down 22.56 points (49.33% to 26.77%).
Authentication remains the primary crisis driver: Only 18.2% of top 10 million domains have valid DMARC records, with merely 7.6% enforcing policies (p=quarantine/reject). Organizations sending 1M+ emails monthly face catastrophic 22.35 percentage point decline (49.98% to 27.63% inbox placement), while only 23.6% of B2B marketers verify email lists before campaigns.
Despite mandatory authentication requirements from Google (February 2024), Yahoo (February 2024), and Microsoft (May 2025), widespread non-compliance creates a dangerous environment where fully authenticated senders are 2.7x more likely to reach inboxes than their unauthenticated counterparts.
Key Statistics (Actual 2025 Data)
| Metric | 2025 Value |
| Email Delivery Rate (B2B) | 98.16% |
| B2B Open Rate | 20.8% |
| B2B Bounce Rate | 2.0% |
| Cold Email Open Rate | 27.7% |
| DMARC Valid Records | 18.2% |
| DMARC Enforcement (p=quarantine/reject) | 7.6% |
| B2B Senders Authenticating | 57.3% |
| Lists Verified Before Campaign | 23.6% |
| Avg Bounce Rate by Industry | 0.42% |
Year-over-Year Inbox Placement Declines (ESP & Mailbox Providers)
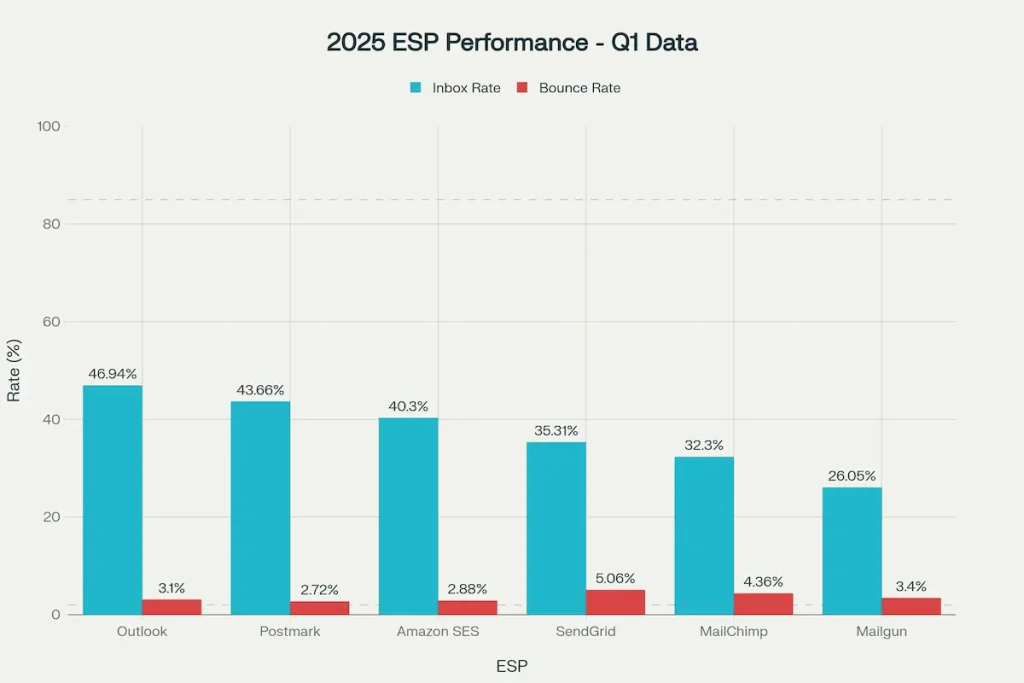
ESP Performance Crisis (Q1 2024 vs Q1 2025)
The first quarter of 2025 revealed alarming inbox placement trends across all monitored email service providers:
| ESP | Q1 2024 Inbox Rate | Q1 2025 Inbox Rate | YoY Change |
| Outlook | 47.50% | 46.94% | -0.56 pp |
| Postmark | 56.90% | 43.66% | -13.24 pp |
| Amazon SES | 54.90% | 40.30% | -14.60 pp |
| SendGrid | 45.30% | 35.31% | -9.99 pp |
| MailChimp | 51.93% | 32.30% | -19.63 pp |
| Mailgun | 53.80% | 26.05% | -27.75 pp |
| Brevo | 30.40% | 24.93% | -5.47 pp |
Average decline: 13.9 percentage points across all ESPs
Mailgun’s catastrophic 27.75 percentage point collapse suggests either algorithmic changes at receiving ISPs heavily targeting Mailgun infrastructure, or a compositional shift toward lower-quality or less-engaged sender bases. SendGrid’s 9.99 percentage point decline, while substantial, trails behind competitors, potentially reflecting its position as the largest volume processor absorbing more aggressive filtering.
Mailbox Provider Performance (Q1 2024 vs Q1 2025)
Performance by receiving mailbox provider shows Microsoft-owned platforms implementing most aggressive filtering:
| Mailbox Provider | Q1 2024 Inbox Rate | Q1 2025 Inbox Rate | YoY Change |
| Outlook/Hotmail | 49.33% | 26.77% | -22.56 pp |
| Office365 | 77.43% | 50.70% | -26.73 pp |
| Gmail | 58.72% | 53.70% | -5.02 pp |
| Google Workspace | 63.85% | 53.36% | -10.49 pp |
| Yahoo/AOL | 43.32% | 40.97% | -2.35 pp |
Microsoft’s 26.73 percentage point Office365 decline represents the worst-performing major mailbox provider. Organizations sending to corporate users face less than a 51% chance of inbox placement. Outlook/Hotmail’s 26.77% placement rate means 7 in 10 emails are filtered away, creating severe engagement and revenue challenges.
Organizations heavily dependent on Microsoft-based inboxes often benefit from a customized deliverability recovery plan led by a senior strategist. Our Fractional Digital Marketing Consultant services support this by aligning infrastructure fixes with pipeline targets, rather than treating deliverability as a purely technical issue.
Gmail’s 5.02 percentage point decline and Google Workspace’s 10.49 percentage point decline reflect ongoing tightening of Google’s algorithms in response to widespread low-quality sending.
What’s Driving the Collapse
At this stage, resolving deliverability is rarely a tool problem. It is a system problem — which requires an integrated approach across infrastructure, engagement strategy, audience segmentation, and messaging. This is where our Answer Engine Optimization frameworks help ensure both inbox visibility and search visibility reinforce each other.
Volume Tiers & Sender Capacity (1M+ Collapse)
Email deliverability shows inverse relationship with sending volume—extreme volume generates severe penalties rather than reputation benefits:
| Sending Volume | Q1 2024 Inbox Rate | Q1 2025 Inbox Rate | YoY Change |
| 1-10k/month | 49.40% | 50.20% | +0.80 pp |
| 10k-50k/month | 61.89% | 56.69% | -5.20 pp |
| 50k-200k/month | 65.01% | 58.29% | -6.72 pp |
| 200k-1M/month | 49.77% | 60.96% | +11.19 pp |
| 1M+/month | 49.98% | 27.63% | -22.35 pp |
Organizations sending 1M+ emails monthly face inbox placement below 28%—meaning more than 7 in 10 emails are filtered or rejected. This represents a 22.35 percentage point year-over-year collapse.
The 200k-1M tier’s surprising 11.19 percentage point improvement suggests that legitimate, well-authenticated high-volume senders are concentrating in this tier, while poorly-authenticated or aggressive senders either reduce volume or face complete filtering at higher tiers.
Low-volume senders (1-10k monthly) maintained stable performance, suggesting ISPs apply less aggressive filtering to modest-volume senders who are more likely to send permission-based communications.
Authentication Failures (SPF, DKIM, DMARC Enforcement)
Major mailbox providers mandated email authentication in 2024-2025:
- Google & Yahoo: February 2024 – SPF, DKIM, DMARC for 5,000+ daily emails
- Microsoft: May 2025 – DMARC for 5,000+ daily emails
- PCI DSS 4.0: March 2025 – DMARC for payment processors
Despite these mandatory requirements, adoption remains dangerously low. Across the top 10 million internet domains (Fortra Q2 2025):
SPF Adoption:
- 36.7% published valid SPF records
- 1.4% published SPF with syntax errors or DNS issues
- 61.9% have no SPF record
DMARC Adoption:
- 18.2% have valid DMARC records
- 10.6% maintain monitoring-only policies (p=none)
- 7.6% enforce policies (p=quarantine or p=reject)
- 81.6% have no DMARC record
Among high-volume B2B senders (100k+ monthly):
- 70% implemented DMARC (up from 56% in 2023)
- 57.3% overall B2B senders authenticate emails (42.7% remain non-compliant)
Critical finding: Even among senders implementing DMARC, only 37% use enforcement policies. The remaining 63% maintain monitoring-only (p=none) policies providing zero protection against spoofing attacks.In most cases, DMARC enforcement aligns naturally with broader governance and brand protection objectives. Our Audit process includes DMARC policy review, alignment analysis, and guided enforcement transitions to avoid accidental mail disruption.
Authentication Impact on Deliverability
Fully authenticated domains (SPF+DKIM+DMARC) achieve 2.7x higher likelihood of inbox placement compared to unauthenticated emails. Practical implications:
- Full authentication: 85-95% inbox placement achievable
- No authentication: 30-50% typical inbox placement
- Partial authentication: 55-70% typical inbox placement
Authentication Hygiene League Table
| Authentication Profile | Inbox Rate (Mean) | Bounce Rate | Complaint Rate |
| YES/YES/YES (Full Auth) | 83.75% | 1.92% | 0.09% |
| YES/YES/NO (No DMARC) | 74.20% | 3.36% | 0.13% |
| YES/NO/YES (No DKIM) | 71.89% | 3.77% | 0.13% |
| NO/YES/YES (No SPF) | 67.48% | 4.19% | 0.16% |
| NO/NO/NO (No Auth) | 44.99% | 8.74% | 0.26% |
The 38.76 percentage point gap between full authentication and no authentication represents substantial pipeline impact.
Domain Age & IP Warmup Impact
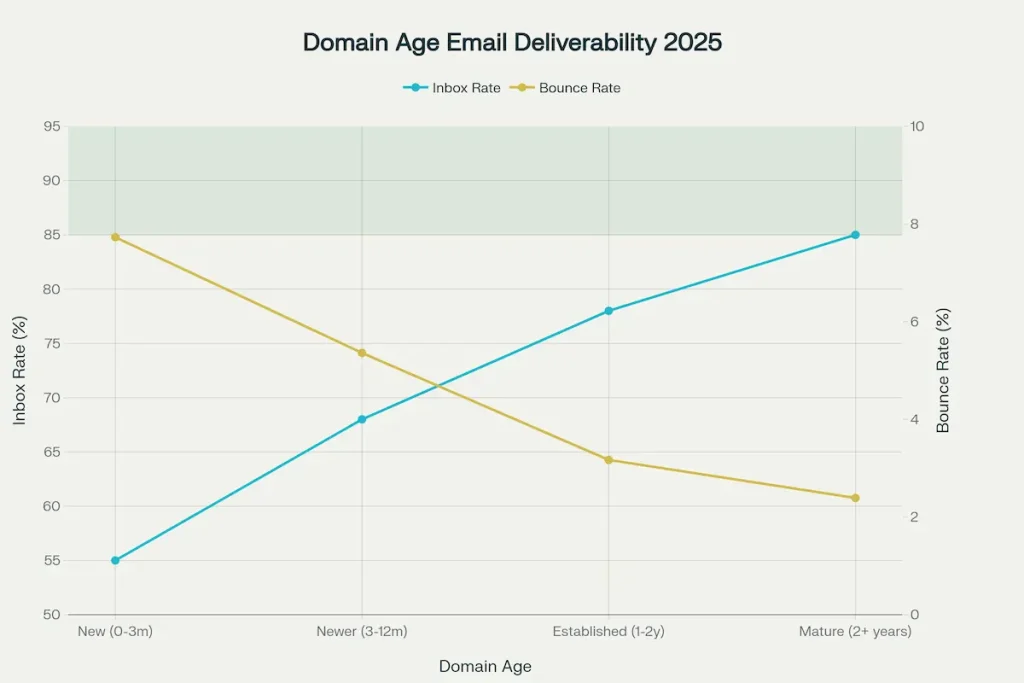
Domain Age as Critical Trust Signal
Domain age significantly influences ISP reputation algorithms. Mature domains achieve approximately 30 percentage point premium over new domains:
| Domain Age | Expected Inbox Rate | Premium vs New |
| New (0-3 months) | 55% | 0 pp (baseline) |
| Newer (3-12 months) | 68% | +13 pp |
| Established (1-2 years) | 78% | +23 pp |
| Mature (2+ years) | 85% | +30 pp |
For organizations planning launches, campaigns, or outbound scaling, we help sequence domain aging, warmup, and messaging rollout as part of a broader growth plan through our Strategic Marketing Consulting engagements.
New domains face ISP skepticism due to lack of historical sending patterns. Organizations planning critical campaigns should register and age domains 6-12 months in advance.
The 30 percentage point premium translates to substantial practical impact: a new domain sending 100,000 emails achieves inbox placement for ~55,000 messages, while a mature domain reaches 85,000—30,000 additional potential customers.
IP Warmup and Reputation Building
Establishing positive sender reputation from new IP addresses requires gradual volume increases over 4-12 weeks. Standard warmup progression:
| Warmup Phase | Timeline | Typical Inbox Rate |
| Phase 1 | Days 1-14 | 60-65% |
| Phase 2 | Days 15-30 | 68-75% |
| Phase 3 | Days 31-45 | 76-82% |
| Phase 4 | Days 46-60 | 78-85% |
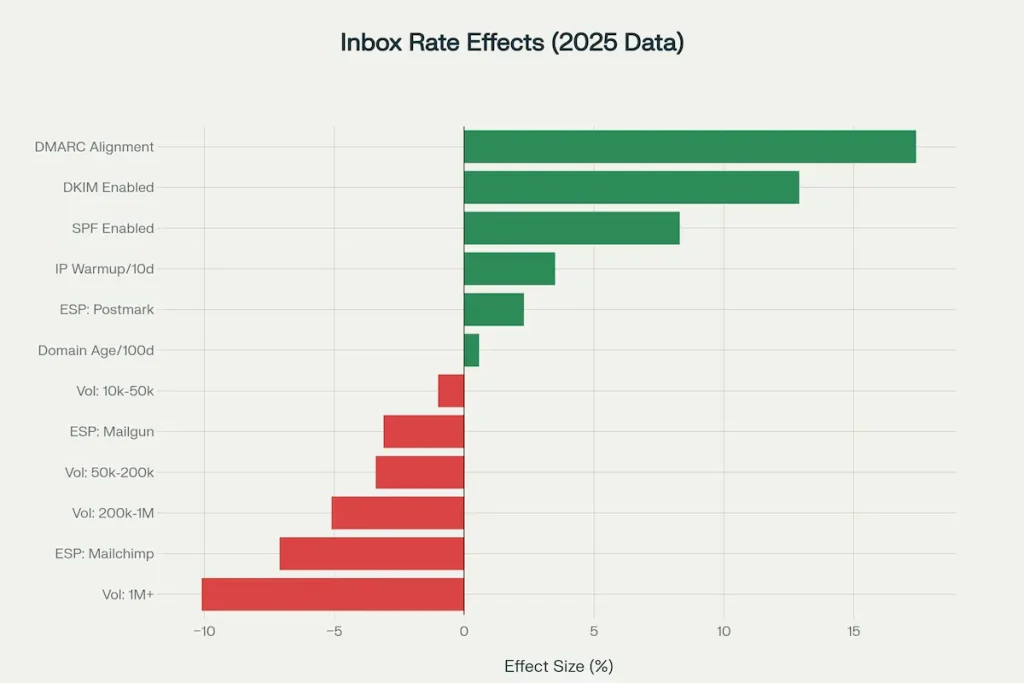
Proper warmup adds approximately 3.5 percentage points per 10 additional days of gradual volume scaling.
2025 B2B Performance Benchmarks (Open, Click, Bounce, Conversion)
Overall B2B Email Metrics (2025)
| Metric | Benchmark |
| Email Delivery Rate | 98.16% |
| Open Rate | 20.8% |
| Click-Through Rate | 3.2% |
| Bounce Rate | 2.0% |
| Conversion Rate | 2.5% |
| Unsubscribe Rate | 0.08% |
Critical distinction: Delivery rate (98.16%) does NOT equal inbox placement—many delivered emails land in spam or junk folders.
To overcome the challenge of delivered emails landing in spam and ensure messages resonate, leveraging AI email personalization offers a strategic advantage, transforming generic outreach into individually relevant communication.
These benchmarks are useful not only for reporting, but for prioritizing which pipeline levers to adjust first. We incorporate them directly into growth planning inside our Fractional CMO model.
Cold Email Performance (Highest-Risk Segment)
Cold email metrics reflect the most challenging B2B segment, where recipients have no prior relationship with senders:
| Metric | 2025 Average | Range |
| Open Rate | 27.7% | 23.9%-42% |
| Reply Rate | 5.1% | 1%-5% |
| Bounce Rate | 7.5% | 7%-8% |
| Conversion Rate | 0.22% | 0.2%-1% |
| Positive Response Rate | 2.0% | 1.5%-3% |
| Meeting Booked Rate | 1.0% | 0.5%-1.5% |
Cold email open rates (27.7%) exceed B2B benchmarks (20.8%), reflecting selection bias where cold campaigns employ tighter targeting and personalization.
Industry & Region Variations
Email deliverability varies substantially by industry, reflecting sender reputation patterns and content types:
| Industry | Inbox Rate | Spam Rate | Difficulty |
| Mining & Minerals | 98.0% | 1.7% | Very Low |
| Healthcare | 94.7% | 4.5% | Low |
| Construction | 93.4% | 4.5% | Low |
| Telecommunications | 88.9% | 5.0% | Moderate |
| Finance | 87.3% | 6.2% | Moderate |
| Retail | 80.5% | 12.0% | High |
| Software/SaaS | 80.9% | 7.6% | High |
Mining and minerals achieves exceptional 98% inbox placement, reflecting transactional, time-sensitive communications with high inherent engagement. Software/SaaS industry’s 80.9% placement reflects aggressive promotional patterns and less rigorous list hygiene.
Bounce Rates by Industry (Performance Indicator)
| Industry | Bounce Rate | Performance |
| Manufacturing | 0.84% | Concerning |
| Software/IT | 0.66% | Concerning |
| Consulting | 0.54% | Above Average |
| Recruitment | 0.50% | Above Average |
| Non-Profit | 0.40% | Good |
| Financial | 0.35% | Good |
| Health & Fitness | 0.32% | Good |
| Retail | 0.31% | Good |
| Education | 0.31% | Good |
| Politics | 0.28% | Good |
| Marketing | 0.27% | Good |
| Entertainment | 0.21% | Excellent |
B2B-focused industries (Manufacturing 0.84%, Software/IT 0.66%) show higher bounce rates, suggesting less rigorous list validation. Entertainment achieves best-in-class 0.21% bounce rate.
Geographic Inbox Placement Differences
| Region | Inbox Placement | Primary Factor |
| Europe | 91.0% | GDPR-compliant lists |
| North America | 85.0% | Mature infrastructure |
| Asia Pacific | 78.0% | Diverse regulations |
Europe’s 91% inbox placement reflects GDPR’s consent requirements producing genuinely permission-based, high-engagement lists. North America’s 85% reflects standardized infrastructure and best practices. Asia Pacific’s 78% reflects varied regulatory environments.
List Hygiene & Data Quality
Email Verification Frequency
Only a minority of B2B marketers follow recommended list verification practices:
| Practice | % of Marketers | Status |
| Verify before every campaign | 23.6% | Best Practice |
| Verify monthly | 40.2% | Recommended |
| Verify quarterly | 20.5% | Minimum |
| Verify yearly | 8.3% | Risky |
| Never verify | 7.4% | Dangerous |
Only 23.6% verify lists before campaigns—the standard for maintaining reputation. 69.6% verify monthly or less frequently, exposing campaigns to accumulating invalid addresses.
Deliverability Fix Plan (Checklist)
Authentication Hygiene (CRITICAL – Highest Impact)
- ☐ DMARC Record Published (p=quarantine or p=reject, not just p=none)
- Configure DMARC alignment (relaxed or strict)
- Expected impact: +17.4 percentage points
- 70%+ of high-volume senders now have DMARC
- ☐ DKIM Signing Enabled
- Use 2048-bit keys (PCI DSS 4.0 requirement)
- Rotate keys every 3-6 months
- Expected impact: +12.9 percentage points
- 85%+ of B2B senders use DKIM
- ☐ SPF Record Configured
- Include all authorized sending IPs
- Stay within 10 DNS lookup limit
- Expected impact: +8.3 percentage points
- 88%+ of B2B senders have SPF
If internal resources are limited, we can run this rollout end-to-end as part of a guided audit engagement. See: Digital Marketing Audit Services.
Domain & IP Infrastructure
- ☐ Domain Age Considerations
- 0-3 months: Expect ~55% inbox rate (high scrutiny)
- 3-12 months: Expect ~68% inbox rate
- 1-2 years: Expect ~78% inbox rate
- 2+ years: Expect ~85% inbox rate (maximum trust)
- Register and age domains 6-12 months before launch
- ☐ IP Warmup Schedule
- 0-14 days: 60-65% inbox rate
- 15-30 days: 68-75% inbox rate
- 31-45 days: 76-82% inbox rate
- 46-60 days: 78-85% inbox rate
- Plan for 30-60 day warmup minimum
Volume Management
- ☐ Volume Tier Planning
- 1-10k/month: Baseline performance (50% inbox)
- 10k-50k/month: -5.2 pp penalty
- 50k-200k/month: -6.7 pp penalty
- 200k-1M/month: Improved at 61% inbox
- 1M+/month: -22.35 pp penalty (27.6% inbox)
- ☐ Scale Gradually
- Avoid volume spikes >50% day-over-day
- Use dedicated IPs for 100k+ monthly volume
- Implement domain rotation for 1M+ senders
List Hygiene & Quality
- ☐ Bounce Rate Targets
- Target: <2% bounce rate
- Industry average: 0.42%
- Remove hard bounces immediately
- Monitor soft bounces after 3-5 attempts
- ☐ Complaint Rate Targets
- Critical threshold: <0.1%
- Warning zone: 0.1%-0.3%
- Danger zone: >0.3%
- Monitor via ISP feedback loops
- ☐ List Maintenance
- Verify lists monthly (best: before every campaign)
- Remove unengaged subscribers after 6-12 months
- Only 23.6% of marketers verify before campaigns
Monitoring & Reporting
- ☐ Regular Audits
- Check Google Postmaster Tools weekly
- Monitor Microsoft SNDS scores
- Review DMARC aggregate reports
- Track inbox placement by ISP
- ☐ Key Performance Indicators
- Daily inbox placement rate by ISP
- Authentication pass rates
- Bounce rate trend (hard vs soft)
- Complaint rate by campaign
- Engagement metrics (open/click)
Key Findings & Strategic Implications
- Authentication Gap Crisis: While regulatory requirements mandate SPF, DKIM, and DMARC, only 7.6% of internet domains enforce DMARC. 92.4% remain vulnerable to spoofing and aggressive ISP filtering.
- High-Volume Sender Penalties: Organizations sending 1M+ emails monthly face 22.35 percentage point year-over-year deliverability collapse, dropping to just 27.63% inbox placement. This necessitates domain rotation, subdomain strategies, or specialized infrastructure.
- Microsoft’s Filtering Crisis: Office365 (50.70% inbox) and Outlook (26.77%) represent catastrophic deliverability challenges with combined 26.73 and 22.56 percentage point year-over-year declines. Organizations heavily reliant on Microsoft users must employ targeted optimization strategies.
- Domain Age Premium: New domains face immediate 30 percentage point deliverability penalty versus mature domains, requiring 6-12 month advance planning for critical campaigns.
- List Hygiene Emergency: Only 23.6% of marketers verify email lists before campaigns, with 69.6% verifying monthly or less frequently, creating accumulating reputation damage.
- Industry Variance: Software/SaaS (80.9%) and Retail (80.5%) face substantially higher deliverability challenges than Mining (98%) and Healthcare (94.7%), requiring industry-specific optimization strategies.
Strategic Recommendations
Immediate Actions (Weeks 1-4)
- Implement Full Authentication: Deploy SPF, DKIM, and DMARC with p=quarantine or p=reject policies (not just p=none)
- Audit Current Compliance: Verify existing authentication status across all sending domains
- List Quality Assessment: Calculate current bounce and complaint rates against industry benchmarks
Short-Term Initiatives (Months 2-3)
- Domain Portfolio Planning: Register and age domains 6-12 months before launching critical campaigns
- Volume Tier Optimization: If sending 1M+ monthly, implement domain rotation or subdomain strategies to avoid high-volume penalties
- List Verification Cadence: Establish monthly (minimum) or campaign-level (ideal) list verification practices
Long-Term Strategy (Months 4+)
- Engagement Segmentation: Implement regular re-engagement campaigns, removing disengaged subscribers after 6-12 months
- Provider-Specific Optimization: Develop distinct strategies for Gmail (53.7%), Microsoft (26.77%-50.70%), and Yahoo (40.97%) based on their divergent filtering approaches
- Industry Best Practice Adoption: Adopt proven practices from higher-performing sectors (Healthcare 94.7%, Mining 98%)
For organizations seeking a structured partner to design and oversee this transition, we provide both advisory and hands-on support. Book Free 15-Minute Discovery Call.
FAQs
What are the most effective B2B cold email deliverability best practices for 2025?
To achieve 85–95% inbox placement in 2025, implement full SPF, DKIM, and DMARC (enforcement policy) authentication, use aged domains, perform regular list hygiene, and avoid high-volume sending patterns that trigger spam filters.
Why did B2B email inbox placement drop on Microsoft platforms in 2025?
Microsoft platforms (Office365 and Outlook) saw significant declines due to stricter anti-spam filters, lack of widespread DMARC enforcement among senders, and penalties associated with new domains and high-volume sending behavior.
How does DMARC enforcement affect B2B email deliverability?
DMARC is a critical factor in 2025, as only 7.6% of domains currently enforce it. Fully authenticated domains using DMARC are 2.7 times more likely to reach the recipient’s inbox compared to unauthenticated domains.
References & Source Data
Deliverability Benchmark Reports
Validity – 2025 Email Deliverability Benchmark Report
GlockApps – Updated Email Deliverability Statistics (2025)
PowerDMARC – Email Deliverability Rate Guide
Authentication Standards & Requirements
EasyDMARC – Why DMARC is Necessary for Enterprises
Warmbox – Domain Age & Deliverability Impact
Suped – IP Warmup Timeline Research
Cold Email & B2B Engagement Data
Martal – B2B Cold Email Statistics
Snov.io – Cold Email Statistics
EasyDMARC – DMARC Enforcement Impact
Industry & Sector Variations
LandBase – Deliverability Statistics by Industry
GlockApps – Domain Age & Inbox Trust
Stripo – Inbox Placement and Engagement Comparison