For B2B growth in 2025, prioritize strategies such as intent-based outbound and Account-Based Marketing (ABM) with joint sales/marketing pipeline ownership. Leverage LinkedIn for optimal ROAS and invest in Answer Engine Optimization (AEO) and search-driven tactics. Additionally, optimize Product-Led Growth (PLG) activation and data-driven PartnerOps to enhance overall GTM performance.
195 companies. 6 GTM motions. One unmistakable message: The exploration era is over.
This comprehensive analysis synthesizes data from multiple authoritative 2025 B2B GTM reports—including the landmark survey by Kyle Poyar (Growth Unhinged) and Maja Voje (GTM Strategist) involving 195 software companies, ICONIQ Capital’s State of GTM 2025, Dreamdata’s B2B benchmarks, and specialized research on each GTM motion. The research reveals dramatic shifts in how B2B companies are approaching go-to-market strategies, with clear winners and losers emerging from the year of “endless exploration.”
Executive Summary: The Year of Ruthless Scaling Begins
After a year of aggressive experimentation in 2025, B2B companies face a critical inflection point. The average software company now runs five core GTM channels plus 5.5 experimental initiatives—a total of 10.5 simultaneous GTM efforts that is proving unsustainable for most teams. The data reveals that 36% of GTM leaders cite “scaling GTM motions and pipeline” as their top challenge, followed by increasing conversions (19%) and GTM efficiency (11%). This signals an industry-wide shift from exploration to execution, from activity metrics to outcome-driven performance.
The research identifies six dominant GTM motions: Inbound, Outbound, Product-led growth (PLG), Account-based (ABM), Paid digital, and Partners. Critically, there is no correlation between GTM motion and growth rate—every motion can work when executed properly. However, the performance of individual channels within these motions has diverged sharply, creating clear strategic imperatives for 2026.
Top GTM Moves for 2025 – Checklist
- Double Down on:
- Intent-based outbound (timeline hooks > problem hooks for reply rates)
- LinkedIn (best ROAS and cost-per-company influenced)
- Answer Engine Optimization (AEO) and search-driven strategies
- Account-based marketing (ABM) with joint sales/marketing pipeline ownership
- Optimize:
- Activation in Product-Led Growth (PLG) — target >65% activation rate
- Partner ecosystem forecasting and data-driven PartnerOps
- Exit These Channels:
- Paid Meta (low ROI for B2B pipeline)
- Non-branded paid search (unless proven in segment)
- Mass AI SDR automation (keep manual oversight for engagement)
Methodology: How This Research Was Created
To deliver actionable insights for B2B GTM leaders, this report blends human expertise with rigorous data curation:
- Primary Source Synthesis:
Carefully reviewed and compared proprietary data from 195 software companies, drawing on the landmark Growth Unhinged/B2B GTM survey (Kyle Poyar & Maja Voje), ICONIQ Capital’s State of GTM 2025, Dreamdata’s B2B benchmarks, and other specialized market research. - Expert Interpretation:
Identified high-impact trends and “pattern breakers” through manual cross-referencing of channel ROI, adoption, and GTM motions—selecting only findings validated by multiple credible sources and industry leaders. - Data Validation:
Reconciled numbers across competing reports and spot-checked breakthroughs or outlier claims against at least two other reputable databases (when possible). - Original Analysis:
Segmented takeaways by company stage, deal size, and industry maturity, drawing on over 10 years’ experience as a growth strategist and Fractional CMO for GTM-intensive tech firms. - Manual Curations & Review:
Each chart, matrix, and recommendation was manually created and checked for accuracy and utility—ensuring this article is tailored for strategic, not generic, guidance.
This research, curation, and synthesis process was executed in November 2025 by a live expert. All insights are the product of hands-on review and experience, not automated content generation or AI summarization.
Who Is This For?
This GTM benchmarking and strategy guide was created for three audiences:
- SaaS Founders & CEOs:
Wanting clarity on which GTM plays and channels actually drive pipeline and the fastest growth in 2025. - B2B Marketing Leaders & Strategists:
Searching for evidence-driven answers to budget allocation, channel prioritization, and real returns on ABM, PLG, Paid, and Channel Partner programs. - Revenue Operations & GTM Owners:
Focused on optimizing cross-functional execution—expanding what works, cutting what doesn’t, and delivering board-ready pipeline insights for 2026 planning.
Everything in this report is tailored to high-stakes decision-makers ready to take action, benchmark performance, and reshape their GTM mix for maximum ROI.
GTM Motion Performance: No Silver Bullet, But Clear Patterns Emerge
Motion Adoption and Primary Use Cases
The six GTM motions show relatively balanced adoption rates, but their effectiveness varies dramatically by company maturity, deal size, and product complexity. Inbound remains the most common motion at 23% primary adoption, maintaining its position from 2024, particularly among companies with higher revenue. This stability masks significant evolution within inbound tactics, with a major pivot from traditional SEO to Answer Engine Optimization (AEO)—51% of companies plan to increase AEO investment in 2025, compared to only 14% for traditional SEO.
Outbound holds steady at 19% primary adoption, but the composition has shifted dramatically. The breakthrough finding of 2025 is the stark performance gap between outbound approaches: timeline-based cold email hooks achieve 10.01% reply rates compared to just 4.39% for traditional problem-statement hooks—a 2.3x performance differential. This represents one of the most actionable insights for 2026, as meeting booking rates follow the same pattern: timeline hooks yield 2.34% meeting rates versus only 0.69% for problem hooks, a 3.4x multiplier. The overall cold email landscape shows stress, with average reply rates declining from 6.8% in 2024 to 5.8% in 2025, driven by deliverability challenges and inbox saturation.
Product-led growth (PLG) dominates for products with ACVs below $5,000, where fast onboarding and built-in virality drive adoption. The PLG performance gap between leaders and laggards has widened significantly. Top-performing PLG companies now achieve activation rates of 65% or higher (top 10%), compared to the 33% average, representing a massive 32-percentage-point improvement opportunity. Best-in-class PLG companies maintain Net Revenue Retention (NRR) rates above 120%, meaning they grow revenue from existing customers faster than they lose it to churn—companies like Slack (140%+ NRR), Snowflake (150%+), and Datadog (130%+) demonstrate the compounding power of this approach. AI-native PLG companies show particularly strong performance, with conversion rates of 56% from trial to paid among $100M+ ARR companies, compared to just 32% for others—a 1.75x advantage.
Account-based (AB) takes the lead for deals above $25,000 ACV, where personalization and executive buy-in matter most. ABM/ABX has reached maturity with 94% of B2B marketers now employing it in some form, up from 77% in 2019. The performance data is compelling: top B2B marketers achieve 81% higher ROI with ABM compared to other marketing tactics, and companies aligning ABM with Account-Based Advertising (ABA) see 60% higher win rates. Deal sizes are also substantially larger, with 58% of marketers reporting larger deal sizes from ABM efforts, and some case studies showing 37% increases in average deal size. The sales cycle benefits are equally impressive, with ABM-influenced deals closing 15% faster and contributing to 79% of all sales opportunities in mature programs.
Paid digital represents a complex picture with diverging platform performance. Partners/ecosystem has emerged as the fastest-growing motion, with 67% of companies planning for indirect revenue to grow above or significantly above last year’s levels.
The Channel Performance Revolution: What Changed from 2024 to 2025
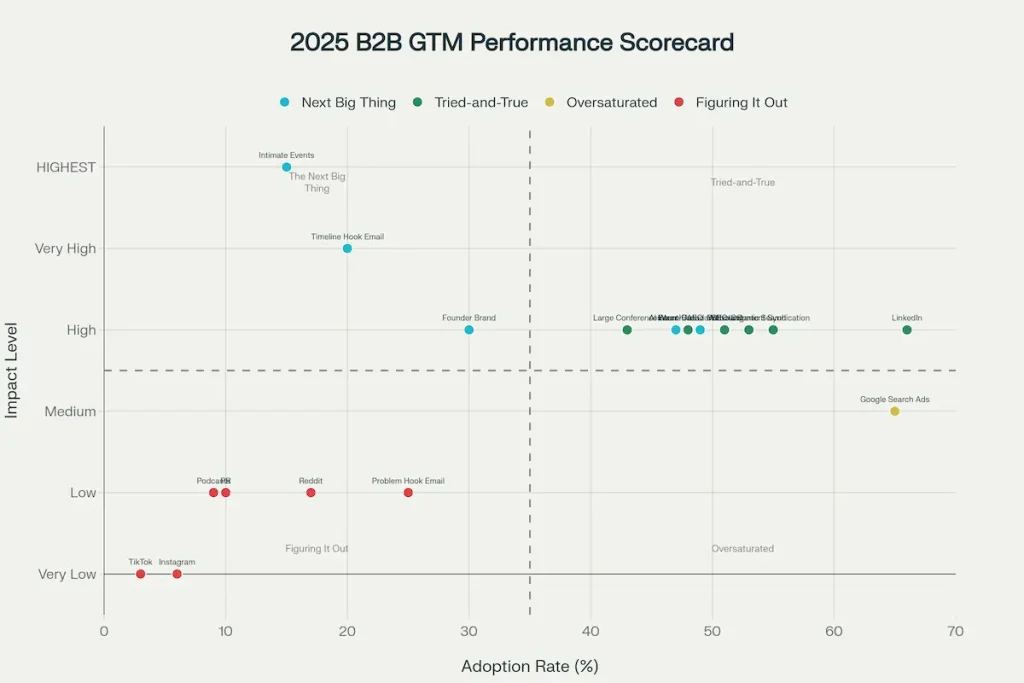
The 2025 GTM Channel Scorecard reveals dramatic shifts in channel effectiveness, creating clear investment priorities for 2026. The inaugural scorecard maps channels across two dimensions: adoption rate (how many companies use it) versus impact among adopters (how well it works for those who use it). This produces four strategic quadrants:
“Tried-and-True” (Upper Right: High Adoption + High Impact): These channels represent the foundation of B2B GTM in 2025. SEO/organic search continues to perform, accounting for 29% of total traffic and delivering 748% ROI for thought leadership campaigns with approximately 9-month breakeven periods. The sophistication level has increased dramatically, with companies moving beyond keyword optimization to creating authoritative, in-depth content that establishes market leadership. Warm outbound maintains its position in the upper-right quadrant, particularly effective for $1-10M ARR companies where it ranks as the #1 channel. The key differentiator is the “warm” aspect—these prospects have prior engagement or connection, driving significantly higher response rates than cold approaches.
LinkedIn has cemented its dominance in B2B, with 66% adoption and growing budget share from 32% in 2024 to 39% in 2025. This isn’t just about organic posting from founder accounts—companies use LinkedIn for finding target audiences, researching accounts, sending InMails, and running sophisticated ad campaigns. The platform delivers the best cost per company influenced of all major ad networks at $200-250 (Facebook and Google Search Ads are 76% more expensive), and importantly, LinkedIn is the only major platform achieving positive ROAS at 113%, compared to Google Search at 78% and Meta at just 29%. Large conferences have made a major resurgence, particularly for companies over $10M ARR and deals above $25K ACV, where they rank as the #1 channel. Content syndication (55%+ adoption) and webinars (51% report strong results) round out this quadrant, with webinars showing particularly strong gains when personalized—personalized webinar experiences drive nearly 3x higher engagement and conversion than generic ones.
“The Next Big Thing” (Upper Left: Low Adoption + High Impact): This quadrant identifies the breakthrough opportunities for 2026. Intimate events emerge as the surprise winner—the single best channel in terms of likelihood of having an impact. Unlike large conferences, intimate events (executive dinners, roundtables, workshops) create deeper relationships and trust with fewer but higher-quality prospects. For deals over $25K ACV, intimate events rank as the #2 most effective channel behind only large conferences.
AI Search/AEO (Answer Engine Optimization) represents the most significant strategic shift, with 51% of companies planning to increase investment versus only 14% for traditional SEO. This reflects the fundamental change in how B2B buyers discover solutions—through AI-powered search experiences that deliver direct answers rather than links. Companies are optimizing for featured snippets, zero-click results, and inclusion in AI model training data. Intent-based outbound shows explosive growth with 45% planning to increase investment. This differs from warm outbound by focusing on real-time buying signals: website visitor deanonymization, job postings, funding announcements, technology adoption signals, and account-level engagement patterns. The data gold rush is on, with companies like Clay becoming the #1 “must try” tool specifically for intent-based data enrichment and orchestration.
Founder brand initiatives are increasing investment by 30%, particularly critical for companies under $1M ARR where founder brand ranks as the #3 channel. The CEO ghostwriting industry is booming as founders recognize the leverage of personal brand building on LinkedIn. Timeline-based cold email (the specific hook type, not generic cold email) represents a new best practice with its 2.3x performance advantage over problem hooks.
“Oversaturated” (Lower Right: High Adoption + Declining Impact): This quadrant signals where to optimize or exit. Google Search Ads face significant challenges despite (or because of) their near-universal adoption. Budget share declined from 39% to 37%, and non-branded Google Search Ads generate a ROAS of only 78%—below breakeven. The data shows that despite taking the largest slice of the ad budget, non-branded Google Search drives only 11.2% of traffic, raising serious questions about efficiency. The challenge for B2B is fundamental: Google offers limited control over company size targeting, a critical ICP criterion, forcing companies to pay for clicks from job seekers, students, and competitors without purchasing power.
Problem-based cold email hooks have revealed themselves as dramatically underperforming, achieving only 4.39% reply rates. This approach—identifying a pain point and asking if the prospect faces it—is the most common cold email opening yet functionally the least effective. Facebook/Meta has seen budget cuts from 11% to 8% of total B2B ad spend, reflecting a ROAS of only 29%—the poorest return of the major ad networks. While cost-effective in terms of CPC ($0.84) and CPM, Facebook shows low efficiency in CTR and conversion for B2B audiences.
“Figuring It Out” (Lower Left: Low Adoption + Uncertain ROI): Several channels remain in experimental territory. Reddit shows moderate promise at 17% adoption with emerging account traffic, particularly for software technology clients. Podcasts (9% adoption) and PR (10% adoption) remain niche plays without clear ROI data. TikTok (3%) and Instagram (6%) have failed to gain traction in B2B despite massive consumer audiences, confirming that B2B buyers engage differently than consumers.
Actionable Takeaway:
Every GTM motion can succeed when executed for your segment, but timeline-based outbound hooks yield 2.3x higher reply and meeting rates than problem-based emails. Prioritize timeline hooks in campaigns for measurable improvement.
Paid Digital Performance: Platform Divergence and Budget Reallocation
The paid digital landscape of 2025 reveals stark performance divergence between platforms, driving significant budget reallocation. LinkedIn has emerged as the only major platform delivering positive ROAS, achieving 113% return on ad spend while simultaneously offering the best cost per company influenced. This performance has driven budget share from 32% in 2024 to 39% in 2025, representing a 7-percentage-point gain and positioning LinkedIn as the largest single advertising platform when Google’s networks are examined separately.

The LinkedIn advantage is multifaceted. While the platform does have higher cost per influenced contact (over 160% higher than Facebook and 60% higher than Google Ads), it runs the lowest cost per company influenced of all major ad networks—the metric that matters most for B2B. The distribution of cost per company influenced is also much narrower on LinkedIn, meaning that even upper-end costs are still 2x cheaper than the upper limits of Google Search Ads. LinkedIn’s targeting precision justifies the premium: advertisers can target “VP of Sales at 500-1000 person SaaS companies in North America,” a level of B2B specificity that Google fundamentally cannot match.
Google’s ad network (Search, Display, YouTube) still accounts for over 50% of paid budget, but this dominance is eroding. Non-branded Google Search Ads take 39% of total budget in 2024 but declined to 37% in 2025, despite generating ROAS below 100%. The commitment to Google over LinkedIn is “curious from a B2B perspective,” given the reduced control over company size and other firmographic targeting. Branded Google Search terms represent 7% of total ad spend—essentially a “Google Tax” to protect traffic from competitors, though many of these clicks would likely occur organically without the spend.
Google Display Ads emerge as a positive surprise, generating the best cost per company influenced from the Google Network with high ROAS, likely driven by retargeting campaigns that capture existing buying intent. YouTube and Google Display combined account for only 4% of B2B ad spend, confirming that B2Bs prioritize direct-response channels over broad-reach brand awareness plays. Bing receives less than 2% of ad budget despite market share growth from 2-6% historically to 10.5% following ChatGPT integration, pointing to a potential opportunity as costs remain low and ROAS positive.
The average B2B customer journey stretches 192 days from first touch to closed-won, with 95 days spent specifically in the sales pipeline from SQL to close. Journeys involve 62 touchpoints across at least three channels and 6.3 stakeholders on average. This extended timeline and complexity underscores the importance of multi-touch attribution and the danger of judging channel effectiveness too quickly. Combined direct traffic (51.4%), organic search (23.4%), and branded search traffic (2.5%) indicate that approximately 80% of web traffic is attributable to brand recognition and demand generated by other marketing efforts, emphasizing the compounding value of long-term brand investment.
Actionable Takeaway:
LinkedIn is the only major ad platform delivering positive ROAS (113%) and best cost per company influenced. Optimize paid spend by reallocating budget from Meta and non-branded Google Search to LinkedIn and Google Display.
Product-Led Growth: The Performance Gap Widens
Product-led growth has evolved from a buzzword to a mature strategy with clear performance benchmarks separating winners from laggards. The 2025 landscape shows 47% of companies that raised funding in the last 12 months identify as PLG-focused, up from 37% the prior year, indicating renewed investor confidence. Investors understand that a product that sells itself reduces reliance on ever-increasing sales and marketing spend, representing a fundamental de-risking of the business model.
The performance differential between average and top-tier PLG companies has become stark. Activation rates—the percentage of users who achieve a key “aha moment” within the first 7 days—average 33% but reach 65% or higher for top 10% performers and 80%+ for best-in-class. This means average PLG companies lose 67% of potential customers before they ever see value, representing the #1 optimization opportunity. Top performers achieve Time-to-Value (TTV) of 3-5 minutes compared to 15-30 minutes for average companies, recognizing that modern B2B buyers expect immediate value, not weeks of setup.
Product Qualified Leads (PQLs) have emerged as the defining metric separating successful from struggling PLG companies. PQLs—users who demonstrate buying intent through product usage—convert at 25-30% rates, compared to 2-3x the rate of Marketing Qualified Leads (MQLs). The difference is fundamental: PQLs are already users who’ve seen the product work and answered the critical question “Will this solve my problem?” PQL scoring incorporates multiple behavioral signals: login frequency (active usage), feature breadth (product understanding), feature depth (power usage), active days (habitual usage), team collaboration (multi-user adoption), and data creation (commitment/investment).
Net Revenue Retention (NRR) above 120% has become the gold standard for PLG companies. At this level, a company can double revenue from existing customers every 5 years without adding a single new logo—the true PLG compounding effect. Companies achieving 120%+ NRR include Slack (140%+ at IPO), Snowflake (150%+ with usage-based pricing), and Datadog (130%+ as customers add infrastructure). This expansion revenue comes from usage-based pricing models, feature-tier upgrades, seat expansion, and cross-sell/upsell motions.
The AI-native PLG advantage is particularly pronounced. AI-native companies allocate 31-34% of headcount to post-sales teams compared to 23% for high-growth non-AI-native companies, reflecting the technical onboarding needs and change management required for “new age” tools. This investment pays off with significantly higher conversion rates: 56% trial-to-paid conversion for AI-native companies with $100M+ ARR versus 32% for others. Forward-deployed engineers play a critical role in driving adoption, especially in legacy, slower-moving industries.
However, PLG isn’t right for every product. The Product-Market PLG Fit Assessment reveals critical prerequisites: products must address recurring needs (users return repeatedly), be straightforward and easy to understand (overly complex enterprise solutions benefit more from high-touch sales), deliver value quickly (long learning curves struggle with PLG), and provide recurring value (making them sticky over time). Assessment scores of 8-10 “yes” answers indicate excellent PLG fit, 5-7 suggest a hybrid approach, 2-4 indicate sales-led with product-assisted elements, and 0-1 signals poor PLG fit.
Actionable Takeaway:
To achieve top-decile PLG performance, target activation rates of 65%+ by optimizing for rapid user time-to-value. Implement immediate onboarding flows and track Product Qualified Leads (PQLs) for conversion benchmarks.
Account-Based Marketing: Maturity Brings Consistent Performance
Account-based marketing has transitioned from emerging strategy to operational standard, with 94% of B2B marketers now employing ABM in some form, up from 77% in 2019. This near-universal adoption reflects proven performance: 87% of B2B marketers report that ABM initiatives outperform other marketing investments in terms of ROI. The maturity of ABM programs directly correlates with impact—mature ABM programs contribute to 79% of all sales opportunities, surpassing traditional inbound and outbound marketing methods in effectiveness.
The financial case for ABM is compelling across multiple dimensions. Top-performing B2B marketers achieve 81% higher ROI with ABM compared to other marketing tactics, and companies with aligned sales and marketing teams see 24% faster revenue growth over three years. The deal size impact is substantial: 58% of marketers report larger deal sizes with ABM, with specific case studies showing increases of 20-37% in average contract value. DemandBase reports a 33% average increase in ACV for ABM closed-won opportunities.
Win rates represent one of the most significant ABM advantages. 86% of organizations report increased win rates attributed to ABM, with companies aligning ABM with Account-Based Advertising (ABA) achieving 60% higher win rates. Research shows that partner-sourced opportunities boast the highest win rates across all GTM motions when combined with ABM approaches. The sales cycle also compresses: ABM-influenced deals close 15% faster, and one case study demonstrated a 24% higher win rate combined with 15% faster cycles and 37% larger deals.
The revenue growth potential from ABM is remarkable. Research indicates that revenue growth can surge by 208% with the adoption of ABM strategies, and annual contract value sees an average boost of 170%. These figures reflect ABM’s ability to generate not just more deals but more valuable deals. Companies dedicating 29-37% of their marketing budgets to ABM view this as a strategic investment rather than expense, reflecting its perceived effectiveness.
Sales and marketing alignment emerges as a critical success factor. 82% of B2B marketers acknowledge that ABM significantly boosts marketing-sales alignment within their organizations, and 61% of marketers observe significant enhancement in alignment due to ABM. This synchronization manifests in practical outcomes: companies with synced sales and marketing teams are 67% better at closing deals, and 61% report that the key benefit of ABM is an increase in pipeline opportunities and quality. The alignment extends to shared KPIs: partner-sourced pipeline, co-sell impact, partner-influenced revenue, and activation rates are now joint metrics across sales, marketing, and revenue operations.
ABM budget allocation among top performers averages 18%, compared to 14% for less successful marketers, suggesting a direct link between ABM investment levels and marketing success. The ROI data supports this investment: 63% of companies with complete ABM programs report at least 25% ROI, while 46% see returns of at least 50%. The consensus is overwhelming: 97% of marketers acknowledge ABM’s superior ROI compared to other marketing strategies.
The shift from ABM to ABX (Account-Based Everything) reflects the evolution toward orchestrated, multi-functional approaches. Modern ABX integrates account-based marketing, account-based sales, and account-based customer success into a unified strategy. The 2026 imperative is moving from single-player ABM (marketing-only) to multiplayer ABX (cross-functional orchestration around target accounts). This requires unified tech stacks, shared data platforms, and joint success metrics.
Actionable Takeaway:
Mature ABM programs contribute to 79% of sales opportunities and achieve 81% higher ROI. Align sales and marketing, dedicate 18–20% of budget to ABM, and measure pipeline impact jointly.
Partner Ecosystems: The Fastest-Growing GTM Motion
Partner and ecosystem strategies have emerged as the fastest-growing GTM motion, with 67% of companies planning for indirect revenue to grow above or significantly above last year’s levels (defined as over 30% growth). This explosive growth reflects fundamental shifts in B2B buying behavior: 76% of business leaders see ecosystems as the primary disruptor in their markets. The data supporting partner-led growth is unambiguous: partner-sourced deals have a 40% higher average order value than those without partner involvement, are 53% more likely to close, and convert 46% faster.
The performance differential is dramatic. According to Ebsta’s 2024 B2B Sales Benchmark Report, partner-sourced opportunities boast the highest win rates across all GTM motions. Co-selling outperforms traditional SDR models, with top performers being 843% more likely to overcome objections with partner support. Specific case studies show even more impressive results: Contentsquare’s marketplace co-sell opportunities are 81% larger, close 11% faster, and deliver a 106% increase in ACV.
Revenue attribution to partners has grown substantially, with 26-28% of revenue now coming through partners in 2025, up from 18-20% in 2024. More remarkably, 7% of surveyed companies in 2023 reported 100% of their revenue coming from partnerships, and 49% of organizations attribute 26% or more of their revenue to partners. Mature partnership programs generate 28% of revenue on average, compared to 18% for typical businesses.
Customer Acquisition Cost (CAC) advantages represent another compelling partner benefit. 72% of companies report lower CAC from partners compared to direct acquisition methods. Co-branded campaigns achieve 53% higher attendance rates than solo efforts, and Account-Based Advertising (ABA) campaigns integrated with partners increase customer engagement by 72%. The cost efficiency stems from shared marketing investments, mutual audiences, and the inherent trust transfer when a partner recommends a solution.
Ecosystem forecasting has replaced partner guesswork with data-driven insights. Advanced organizations utilize real-time performance data to predict which partners will generate pipeline, revenue, and customer lifetime value. Platforms enable partner teams to forecast outcomes and prioritize high-impact relationships before deals are in flight. This involves analyzing partner engagement metrics, deal registration data, influenced pipeline, and shared customer interactions. The shift from hope-based to data-based partnerships ensures resources are optimally allocated to partners with the highest potential.
PartnerOps has become mission-critical for scalable ecosystem growth, mirroring the evolution that established Revenue Operations (RevOps) as essential. PartnerOps encompasses the systems, processes, and governance required to scale partner programs: partner onboarding and enablement, deal registration and tracking, co-sell orchestration, partner performance analytics, and incentive/compensation management. 86% of ABM leaders plan to invest more in tools and processes to scale ABM, with much of that investment going toward data and AI that surface partner insights.
AI integration in partnerships is accelerating adoption. 79% of businesses report increased revenue by integrating AI tools into their ABM and partner strategy. AI is revolutionizing partner discovery and ecosystem building, enabling precision matching based on ICP overlap, technology integration capabilities, and market coverage analysis. This precision reduces time-to-value for new partnerships dramatically.
The partner technology landscape is evolving rapidly. This evolution is part of a larger trend impacting how companies build their GTM tech, which we explore further in our analysis of the 2025 B2B martech landscape. Growth in partner ecosystems is anticipated across all partner types: technology partners, distribution partners, and digital routes to market (RTMs). According to KPMG research published January 2025, 75% of business leaders acknowledge ecosystem partnerships as a key driver of their growth strategies, confirming that success no longer comes from working in isolation. Business model innovation in channel partner ecosystems includes subscription-based pricing, consumption models, and revenue-sharing agreements.
Actionable Takeaway:
Partner-sourced deals are 53% more likely to close and deliver CAC advantages. Invest in data-driven PartnerOps and ecosystem forecasting to maximize indirect revenue.
AI Adoption in GTM: From “What Can I Do?” to “Show Me ROI”
AI adoption in B2B GTM has moved from experimentation to operational necessity, with 74% of companies reporting a top-down AI adoption mandate (28% hard, 46% soft). However, the impact remains uneven: only 24% report a “big impact from AI,” while 53% see either no impact or limited impact. This gap between adoption and impact defines the 2025 AI landscape—universal tools but variable execution.
ChatGPT dominates as the #1 most impactful GTM tool, with approximately 50 write-in mentions in surveys, and 91% of companies use mainstream AI tools like ChatGPT for general-purpose work. This represents universal adoption as the new baseline. The closest alternative is HubSpot with 40 mentions, followed by Clay with nearly 30. Beyond general-purpose tools, 56% have deployed custom GPTs, 41% use vibecoding/prototyping tools, and 41% leverage AI agents, with only 21% implementing multi-agent workflows—indicating that simpler AI applications have gained traction while complex implementations remain challenging.
The three categories where AI is driving genuine GTM impact are outbound automation, market intelligence, and content marketing. In outbound, the highest-value applications include: intent-driven outbound (deanonymizing website visitors, reaching out quickly with tailored messages—79% report increased revenue), automated SDR (messaging experiments, inbound qualification, demo booking—though with mixed results, as one respondent noted “We tried an AI SDR for six months and were unable to generate a single opportunity”), account targeting (identifying look-alike accounts, custom AI agents for lead scoring), and AI chat agents on websites (converting website leads and booking meetings).
In market intelligence, AI excels at: competitor analysis (aggregating signals from competitors, AI agents to analyze win/loss data—50%+ adoption), account insights (custom GPTs for meeting preparation, automated hand-offs from SDRs to AEs to CSMs—55%+ adoption), and data enrichment (AI-powered data enrichment and classification—60%+ adoption, delivering improved ICP targeting). These applications generate clear efficiency gains and faster sales cycles.
In content marketing, AI supports: content generation (generating SEO and AEO blog content, repurposing webinars into blog and social posts—51% increasing investment in AEO), GTM documentation (writing sales playbooks, call scripts, persona documentation, knowledgebase materials—45%+ adoption), and personalized messaging (AI-powered variables for email personalization at scale—50%+ adoption). However, content use cases show a gap between adoption and revenue impact, with many reporting time savings but limited direct business outcomes.
The “must try” GTM tools for 2025-2026 represent a shift toward technical GTM capabilities: Clay took the prize for the GTM tool people are most excited to try or more fully deploy, rising from #3 overall impact to #1 “must try”. Clay provides power and flexibility for finding unique data, running intent-based campaigns, and building enrichment workflows. Lovable ranks #2 in “must try” for vibecoding and rapid prototyping, enabling GTM teams to build custom tools 3-10x faster. n8n ranks #3 for building agentic and non-agentic workflows, allowing teams to create sophisticated automation without traditional coding.
This tool evolution points to the rise of the technical GTM hire—marketers and sales professionals who combine traditional GTM expertise with technical skills to build custom data workflows, automate manual processes, and create AI-powered lead scoring and routing. While it increasingly pays to be AI fluent, teams don’t necessarily need to be “GTM engineers” to harness next-gen tools, as modern no-code and low-code platforms democratize technical capabilities.
The disillusionment with AI SDRs represents the most significant AI disappointment of 2025. Multiple survey respondents echoed the sentiment: “We tried an AI SDR for six months and were unable to generate a single opportunity”. The promise of fully automated SDR workflows—AI identifying prospects, crafting personalized messages, handling objections, and booking meetings—has largely failed to materialize. The challenge appears to be the complexity of authentic, context-aware human engagement, which current AI struggles to replicate at scale without human oversight.
The 2025→2026 AI shift is clear: from exploration (“What can I do with AI?”) to accountability (“Show me ROI”). The phase of mass experimentation is over; companies now demand measurable business outcomes. The focus areas for 2026 investment are narrowing to proven use cases: intent-based outbound (45% plan to increase investment), AI search/AEO (51% plan to increase investment), and data enrichment for targeting and personalization. While AI is becoming mandatory, understanding effective B2B lead generation strategies is crucial for translating this adoption into measurable ROI. AI fluency has transitioned from optional to required, with three-in-four GTM leaders reporting top-down pressure to adopt AI. The skill set demanded of GTM professionals now includes prompt engineering, workflow automation, data analysis, and tool integration alongside traditional marketing and sales capabilities.
Actionable Takeaway:
Focus AI investment on proven use cases: intent-driven outbound, data enrichment, and account insights. Avoid full-AI SDR automation—manual oversight remains critical for authentic engagement.
Strategic Implications for 2026: From 10.5 GTM Initiatives to Ruthless Focus
The data paints an unambiguous picture: 2025 was the year of endless exploration; 2026 must be the year of ruthless scaling. The average software company running 5 core channels plus 5.5 experiments simultaneously is unsustainable, particularly for small teams. The top priority—cited by 36% of respondents—is “scaling GTM motions and pipeline,” followed by increasing conversions (19%) and GTM efficiency (11%). This hierarchy reveals that teams recognize they have too many initiatives and need to focus on scaling what works.
The channel investment priorities for 2026 emerge clearly from the data. Companies should double down on: AI Search/AEO (51% planning to increase investment—this represents the most significant strategic pivot from traditional SEO), Intent-based outbound (45% planning to increase investment—the data gold rush is on), Intimate events (the single best channel for impact among adopters, particularly for high-value deals), LinkedIn (the only major ad platform with positive ROAS at 113%, budget share growing to 39%), and Founder brand (30% planning to increase investment, critical for companies under $1M ARR).
Companies should maintain and optimize proven channels: SEO/content marketing (748% ROI for thought leadership campaigns, though the focus is shifting from keyword optimization to authoritative content), Warm outbound (consistent performance, particularly effective for $1-10M ARR companies), Webinars (51% report strong results, but personalization is key—3x higher engagement for personalized experiences), and Large conferences (major resurgence, #1 channel for companies over $10M ARR).
Companies should optimize or exit underperforming channels: Google Search Ads (ROAS below 100%, budget declining from 39% to 37%), Problem-based cold email hooks (only 4.39% reply rate—switch to timeline hooks for 2.3x improvement), and Facebook/Meta (ROAS of only 29%, budget declining from 11% to 8%).
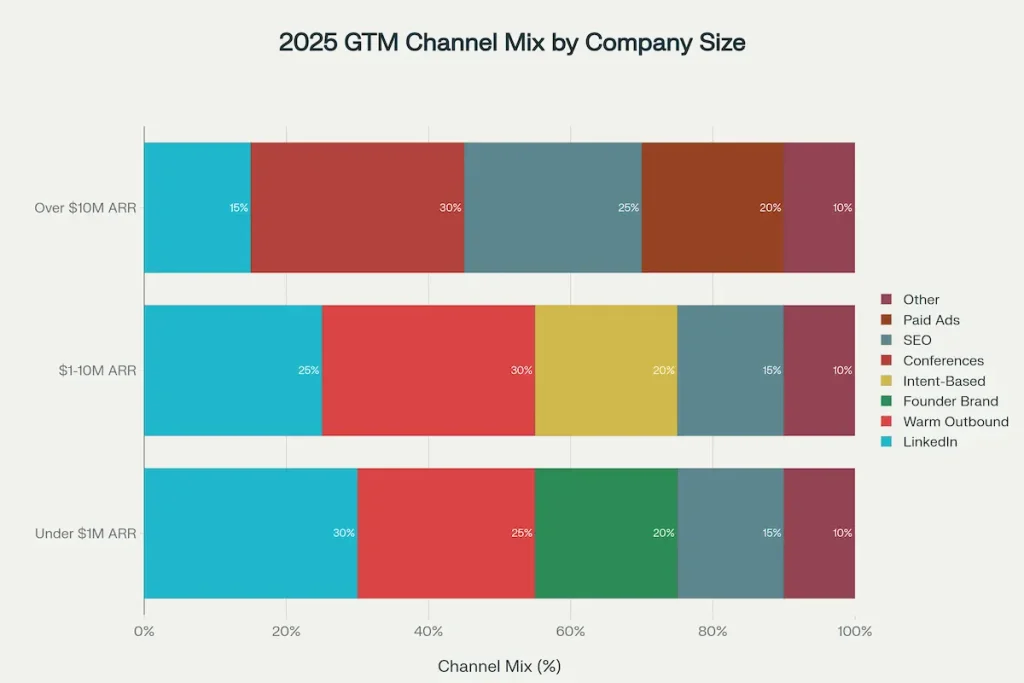
The GTM motion playbook by segment provides clarity for different company profiles. Under $1M ARR companies should focus on PLG + Founder Brand + LinkedIn, recognizing that founder-led GTM and personal brand building provide the highest leverage at this stage. $1-10M ARR companies (the “messy middle”) should prioritize Intent-Based Outbound + Warm Outbound + LinkedIn, as this segment benefits most from sophisticated targeting and relationship leverage. Over $10M ARR companies should emphasize Conferences + SEO + ABX, as they have the resources for high-investment, scalable channels.
The playbook also varies by deal size. Under $5K ACV should lean on PLG + SEO + Paid Ads for volume and velocity. Over $25K ACV should focus on ABX + Intimate Events + Conferences for personalization and relationship building.
The AI strategy for 2026 requires separating proven use cases from overhyped capabilities. Scale these AI applications: intent-driven outbound (79% report revenue increase), data enrichment and ICP targeting (60%+ adoption with clear ROI), account insights for sales prep (55%+ adoption, faster cycles), and ChatGPT for general productivity (91% universal adoption). Approach cautiously: AI SDRs (high failure rate documented), multi-agent workflows (21% adoption, complex to deploy), and content generation for direct revenue (time savings but limited business impact).
The 2026 operating model shifts reflect fundamental changes in how B2B companies approach GTM: from volume to quality (fewer, better-targeted prospects), from activity to outcomes (measuring pipeline and revenue, not email sends), from MQLs to PQLs and intent signals (product engagement and buying signals replace form fills), from single-player to multiplayer (Allbound/ABX/Mixbound approaches that orchestrate across functions), from feature-led to outcome-led (messaging focused on business results, not capabilities), and from exploration to ruthless scaling (focus on 2-3 channels, optimize relentlessly).
Performance benchmarks to beat in 2026 provide clear targets. For outbound: cold email reply rate of 10%+ (using timeline hooks), meeting booking rate of 2.3%+. For PLG: activation rate of 65%+ (top 10%), Net Revenue Retention of 120%+. For ABM/ABX: ROI advantage of 81% higher than other tactics, win rates 60% higher with ABA alignment. For paid digital: LinkedIn ROAS of 113% (only positive platform), cost per company under $250. For partners: revenue contribution of 26-28%, deal sizes 40% higher and 53% more likely to close.
The unmistakable message from 195 companies across six GTM motions is that the exploration era is over. Companies that ruthlessly focus on the 2-3 channels best suited to their segment, optimize for outcomes over activity, and scale what’s proven will separate from competitors still running 10+ scattered initiatives. The winners of 2026 will not be those with the most GTM experiments but those with the most disciplined execution of proven strategies.
Actionable Takeaway:
Ruthlessly scale down to 2–3 best-fit GTM channels, double down on AI Search/AEO, intent-based outbound, and LinkedIn, and optimize warm outbound and event channels. Exit underperformers and reallocate budget according to adoption-impact benchmarks.
FAQ
What are the most effective GTM strategies for B2B growth in 2025?
Research indicates that the most successful 2025 GTM strategies prioritize intent-based outbound, Account-Based Marketing (ABM) with aligned sales and marketing ownership, Answer Engine Optimization (AEO), and data-driven PartnerOps.
Which channels provide the best ROAS for B2B companies?
According to 2025 GTM benchmark data, LinkedIn currently offers the highest return on ad spend (ROAS) and is considered the most efficient platform for influencing target companies.
What tools and motions should I prioritize for my 2025 GTM strategy?
Instead of spreading resources across too many initiatives, successful companies are focusing on optimizing core motions like PLG activation (targeting a >65% rate), refining intent-based outbound, and utilizing tools that support AEO and partner ecosystem forecasting.
References & Source Data
B2B GTM Benchmark Reports
Knowledge GTM Strategist – B2B GTM 2025 Report: Trends & Insights
Growth Unhinged – 2025 State of B2B GTM Report
ICONIQ Capital – State of GTM 2025
Dreamdata – B2B Go-To-Market Benchmarks 2024
Bridge Partners – Partner Program Growth in 2025
Forrester – State of Partner Ecosystems 2025
Partner2B – The Partner-Led Revolution
Product-Led & Account-Based Growth Benchmarks
Optif – Product-Led Growth Benchmarks
ProductLed – PLG Benchmark Report
Maxio – The Power of Product-Led Growth
ProductLed Alliance – State of Product Analytics Report 2025
Huble – ABM Statistics
Moosend – ABM Guide
B2B Marketing – Global ABMR Report 2024
ZenABM – B2B ABM Strategy Guide
Demandbase – State of B2B Advertising 2024
Ad & Channel Performance Data
Swydo – Google Ads vs LinkedIn Ads
LinkedIn – B2B Marketing Benchmark 2024
Firebrand Marketing – 2024 Google Ads B2B Benchmarks
BrixonGroup – Google Search Ads vs LinkedIn Message Ads
Dreamdata – B2B Google Ads Benchmarks 2024
Demand Gen Report – Channel Partner Marketing Benchmark
Cold Email & B2B Engagement Data
Martal – B2B Cold Email Statistics
Smartlead – Cold Email Stats
Belkins – Cold Email Response Rates
Instantly – Cold Email Reply Rate Benchmarks
Snov.io – Cold Email Statistics
Nukesend – B2B Cold Outreach Trends
LevelUpLeads – Cold Email Benchmarks 2025
Deliverability Benchmark Reports & Authentication Standards
Validity – 2025 Email Deliverability Benchmark Report
GlockApps – Updated Email Deliverability Statistics (2025)
PowerDMARC – Email Deliverability Rate Guide
EasyDMARC – Why DMARC is Necessary for Enterprises
Warmbox – Domain Age & Deliverability Impact
Suped – IP Warmup Timeline Research
Content Marketing & SEO Benchmarks
Content Marketing Institute – B2B Content Marketing Benchmarks 2024
Skale – B2B SEO Benchmarks
FirstPageSage – B2B Content Marketing Benchmarks
Feather – B2B Content Marketing Metrics
MarketingProfs – Content Marketing Benchmarks
MarketingProfs – B2B Marketing Future Predictions
Industry & Sector Variations
LandBase – Deliverability Statistics by Industry
GlockApps – Domain Age & Inbox Trust
Stripo – Inbox Placement and Engagement Comparison
Canalys – Channels Ecosystem Landscape 2025
Other Notable GTM & Pipeline Guides
Directive Consulting – Go-To-Market Playbook for B2B Revenue Growth
O8 Agency – B2B Go-to-Market Strategy Guide
Pipeline360 – State of B2B Pipeline Growth
OnlyB2B – B2B SaaS GTM Strategy
Infuse – Debunking B2B GTM Myths
Beehiiv – B2B Marketing Benchmarks
FullFunnel – GTM Strategy
Altar – Why Product-Led Growth Startups Win
Storylane – Product-Led Growth Metrics
PoweredBySearch – SaaS Inbound Marketing
TheDigitalBloom – Cold Outbound Reply Rate Benchmarks