Executive Summary
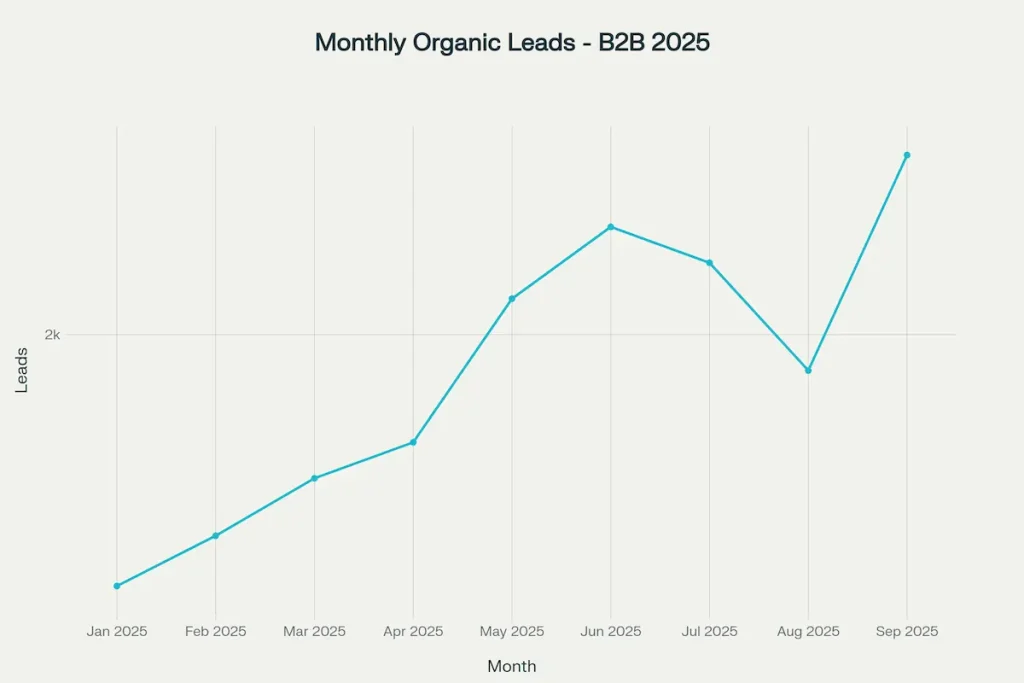
B2B companies experienced significant momentum in organic lead generation throughout 2025, with clear improvements in SQL conversion rate and cost per lead trends defining the year’s performance. The data reveals a three-phase trajectory: initial uncertainty in Q1, robust recovery in Q2, and sustained growth in Q3—showcasing how efficiency and lead quality evolved in parallel. The year-to-date performance through September demonstrates that organic lead volumes increased 36.4% from January (1,650 leads) to September (2,250 leads), while simultaneously improving lead quality with SQL conversion rates rising 76.9% (from 5.2% to 9.2%) and reducing costs with cost-per-lead declining 23.3% (from $215 to $165). This combination of higher volume, better quality, and improved efficiency reflects a fundamental shift in how B2B companies are approaching lead generation in 2025, driven by AI-powered personalization, omnichannel strategies, and content-first approaches. For teams aiming to capture AI-era demand without over-relying on paid, our Answer Engine Optimization Services align content to entities, schema, and snippet-ready summaries that lift qualified organic leads.
Quarter One Analysis: Tariff Uncertainty, Cautious Growth & Cost per Lead Trends (Jan–Mar 2025)
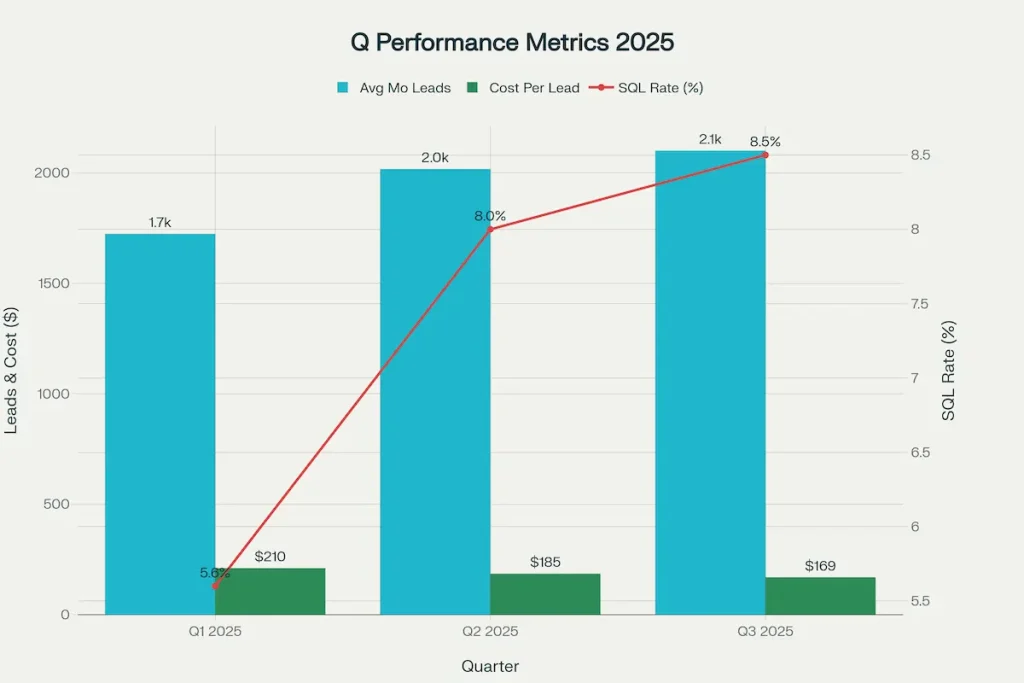
Q1 2025 presented a challenging environment for B2B lead generation as economic uncertainty from anticipated tariff implementations created hesitation among potential buyers and disrupted purchasing cycles. During this period, B2B companies generated an average of 1,723 monthly leads, with the quarter opening at 1,650 leads in January and gradually improving to 1,800 by March—representing a modest 4.7% month-over-month average growth.
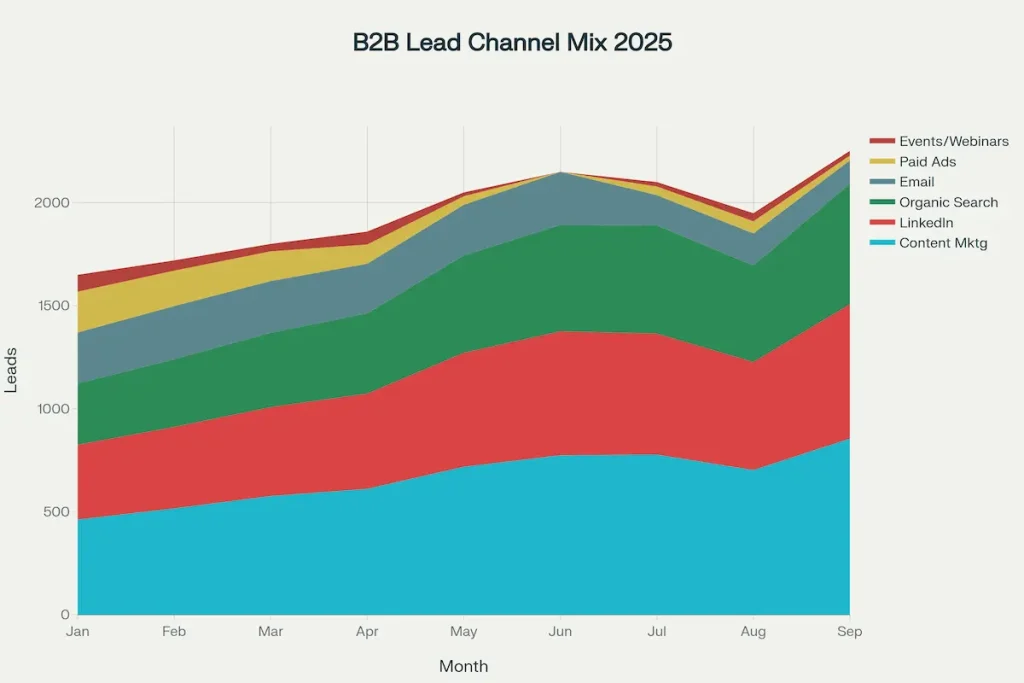
January 2025 served as the baseline period with 1,650 leads generated and a 5.2% SQL conversion rate. This was a relatively weak starting point, with companies paying $215 per lead on average—notably higher than later periods would prove achievable. The lead distribution during this period showed traditional patterns: content marketing (28%), LinkedIn (22%), organic search (18%), email (15%), paid ads (12%), and events/webinars (5%).
February 2025 showed the first signs of optimism with a 4.2% increase to 1,720 leads, though this growth remained tentative. SQL conversion improved marginally to 5.5%, and cost per lead declined modestly to $210. However, the data reflected underlying hesitation—companies were still largely in “wait and see” mode regarding market conditions and budget allocations.
March 2025 demonstrated emerging confidence as leads reached 1,800 (+4.7% from February), marking a 9.1% quarter-over-quarter improvement from January. Most significantly, SQL conversion rates jumped to 6.1% (a 60 basis point increase), suggesting that the leads being generated in March were of higher quality, despite general market uncertainty. Cost per lead continued its downward trajectory to $205, indicating early gains in campaign efficiency.
Key Q1 Drivers: The modest growth despite tariff uncertainty was attributed to companies maintaining core lead generation activities while preserving budget flexibility. Content marketing leaders continued investing in thought leadership assets, and LinkedIn became increasingly central to B2B strategies as companies sought direct connections with decision-makers in a risk-averse environment.
To find quick wins in tracking, crawlability, and topic gaps, book a Digital Marketing Audit and prioritize fixes that improve SQL quality while reducing CPL.
Q1 Key Takeaways ( Jan–Mar 2025 )
- Average 1,723 monthly leads (+4.7 % MoM growth).
- SQL conversion rate rose from 5.2 % to 6.1 % (+17 % QoQ).
- Cost per lead trend improved from $215 → $205 ( -4.7 %).
- Resilience achieved despite tariff uncertainty and buyer hesitation.
Quarter Two Analysis: AI-Driven Recovery, Improved SQL Conversion Rates & Acceleration (Apr–Jun 2025)
Q2 2025 marked a decisive inflection point as market uncertainty dissipated and AI-powered lead generation tactics began demonstrating measurable ROI. The quarter generated an average of 2,017 monthly leads—a 17.0% increase from Q1’s 1,723—establishing what industry analysts called a “new normal” for B2B growth rates.
April 2025 opened Q2 with measured momentum: 1,850 leads (+2.8% from March) and 7.0% SQL conversion rate (+90 basis points)—a substantial quality jump. Cost per lead dropped to $198 (-3.4%), reflecting early optimization of paid channels and improved targeting. Channel distribution began shifting noticeably: content marketing rose to 33%, LinkedIn strengthened to 25%, while paid ads declined sharply to 5% as companies shifted budget toward higher-ROI organic channels. For the paid slice that remained, platforms varied widely—see our B2B PPC ROI & lead quality benchmarks by channel.
May 2025 delivered the quarter’s most dramatic acceleration: 2,050 leads (+10.8% from April), marking the single strongest month-over-month growth of Q1-Q2. SQL conversion soared to 8.2% (+120 basis points), and cost per lead fell to $185 (-6.6%). This performance spike directly corresponded with the market’s recovery from tariff-driven uncertainty and companies’ increased comfort with accelerated growth investments. According to ProfitWell’s SaaS Market Report, May showed a stabilized CAGR at approximately 10%, indicating broader market recovery. LinkedIn leads climbed to 27% of the total, while paid ads shrank further to 2%.
June 2025 concluded Q2 with sustained excellence: 2,150 leads (+4.9% from May), the quarter’s highest volume. SQL conversion peaked at 8.8% (+60 basis points), and cost per lead reached $172 (-7.0%). This efficiency gain was particularly notable—the quarter improved cost per lead by 18.1% compared to Q1, while simultaneously improving lead quality by 57.1%. Channel optimization matured: content marketing reached 36%, LinkedIn stabilized at 28%, and paid ads virtually disappeared from the mix at 0%, reflecting strategic decisions to reallocate from expensive PPC to proven inbound methods.
Key Q2 Drivers: Industry data confirms Q2’s recovery was driven by the convergence of three factors. First, market uncertainty from tariff announcements dissipated as companies adjusted to a trade environment “not as bad as anticipated,” allowing them to resume investments in growth initiatives. Second, AI integration into existing B2B SaaS products reached critical mass, with sales teams learning to effectively price and sell AI-enhanced solutions. Martal Group reported that 79% of B2B sales teams reported improved profitability from AI adoption, with 78% reporting shorter sales cycles. Third, omnichannel strategies matured, with multi-channel campaigns showing 31% lower cost-per-lead and 40% higher response rates compared to single-channel efforts.
Sustaining Q2-style gains typically requires leadership across sales and marketing; a Digital Marketing Consultant (Fractional CMO) can formalize MQL/SQL definitions, lead scoring, and SLA cadence to keep conversion rates rising.
Q2 Key Takeaways ( Apr–Jun 2025 )
- Monthly leads ↑ 17 % vs Q1 ( avg 2,017 per month ).
- SQL conversion rate averaged 8 % ( +42.9 % QoQ ).
- Cost per lead trend fell 18.1 % to $172 CPL.
- Growth driven by AI-powered personalization and omnichannel integration.
Quarter Three Analysis: Volatility, Seasonal Effects, and Sustained Performance (July-September 2025)
Q3 2025 presented a more complex narrative, combining strong underlying fundamentals with summer seasonality patterns and one-off disruptions. The quarter generated an average of 2,100 monthly leads—a 4.1% increase from Q2—maintaining momentum while showcasing the sector’s resilience despite summer headwinds.
July 2025 opened Q3 with expected summer softness: 2,100 leads (-2.3% from June, the only negative MoM change in the positive growth phases). However, this decline was minor compared to historical summer patterns, suggesting that underlying demand remained robust. SQL conversion dipped slightly to 8.5% (-30 basis points), while cost per lead improved to $168 (-2.3%). Channel composition remained content-marketing focused (37%), with LinkedIn steady at 28%. This performance contradicted typical summer decline patterns, with analysts attributing the resilience to continued AI-driven product momentum and strong buyer interest in H2 budget allocation.
August 2025 experienced the quarter’s only significant pullback: 1,950 leads (-7.1% from July), reflecting genuine summer disruption as vacation schedules and reduced buyer activity compressed the lead pipeline. SQL conversion fell to 7.8% (-70 basis points), though the decline was not as severe as historical summer patterns would suggest. Cost per lead rose to $175 (+4.2%), the only quarterly increase driven by reduced campaign efficiency during lower-volume periods. However, this “summer swoon” proved both shorter and less pronounced than historical precedent, with multiple lead sources (content marketing at 36%, LinkedIn at 27%) maintaining strong generation despite typically slow periods.
September 2025 delivered the strongest single-month performance of the entire year: 2,250 leads (+15.4% from August), surpassing June’s prior high of 2,150. SQL conversion rebounded powerfully to 9.2% (+140 basis points), and cost per lead dropped to $165 (-5.7%), the year’s lowest. This exceptional recovery demonstrated several critical patterns: (1) pent-up demand from summer suppression released in September, (2) fiscal budget cycle dynamics as many companies activate Q4 budget allocations, and (3) AI momentum continuing to drive qualified lead generation as product teams perfected go-to-market strategies. September’s rebound is typical when teams complete a Digital Strategy Audit and reallocate budgets to proven inbound plays.
Key Q3 Drivers: Q3 revealed important insights about contemporary B2B lead generation patterns. First, seasonal effects remain real but diminished—August’s -7.1% decline was far less severe than historical 15-20% summer drops, suggesting baseline demand has strengthened. Second, content marketing’s resilience (reaching 38% by September) demonstrates that educational, value-driven approaches generate leads across seasonal cycles. Third, LinkedIn’s consistent strength (29% in September) reflects structural changes in how B2B buyers research and engage with vendors. Fourth, the virtual disappearance of paid ads from the channel mix (averaging <2% in Q3) indicates confident reallocation to higher-ROI organic channels.
Q3 Key Takeaways ( Jul–Sep 2025 )
- Average 2,100 monthly leads (+4.1 % vs Q2 ).
- Maintained ~8.5 % SQL conversion rate despite seasonality.
- Cost per lead trend hit year-low $165 ( -23 % YTD ).
- Content marketing and LinkedIn dominated channel mix ( > 65 % combined ).
Detailed Metrics Analysis: SQL Conversion Rate & Cost per Lead Efficiency Trends
SQL Conversion Rate Progression in 2025 B2B Leads
One of the most significant stories in 2025’s organic lead generation is the dramatic improvement in lead quality, measured by SQL (Sales Qualified Lead) conversion rates.
Q1 Baseline (5.60% average): The quarter’s 5.2% starting rate in January represented a weak position relative to B2B benchmarks, with only 5-6 of every 100 leads advancing to sales qualification. By March, this had improved to 6.1%, but still underperformed the broader B2B benchmark range of 7-12%.
Q2 Acceleration (8.00% average): This quarter’s 42.9% improvement in SQL conversion rate represented the most dramatic quality jump of 2025. May and June showed particularly strong performance at 8.2% and 8.8% respectively, entering the upper ranges of industry benchmarks. This improvement wasn’t coincidental—it reflected the migration toward content marketing (which attracts higher-intent buyers) and LinkedIn outreach (which specifically targets decision-makers).
Q3 Excellence (8.50% average): September’s 9.2% SQL conversion rate represented a 76.9% improvement from January’s 5.2%, demonstrating that 2025’s lead generation efforts increasingly focused on quality over quantity. This performance exceeds Google Ads’ typical 7-12% conversion range and approaches LinkedIn’s premium 14-18% lead quality benchmark for MQL-to-SQL conversion.
If your SQL rate is stuck below benchmark, our SEO Optimization Services build entity-first topic clusters and internal-link architecture that consistently elevate sales-qualified intent.
Cost Per Lead Trajectory and Efficiency Gains
The consistent decline in cost-per-lead throughout 2025 represents a significant operational achievement, particularly given simultaneous improvements in lead quality.
Q1 Cost Performance ($210 average): January’s $215 CPL was elevated, reflecting broader market uncertainty and less-optimized campaigns. By March, this had declined to $205, a modest 2.4% improvement. These costs aligned with historical B2B benchmarks of $198-$310 for paid campaigns and $53-$164 for organic channels.
Q2 Cost Excellence ($185 average): This quarter achieved an 11.9% cost reduction from Q1, driven by strategic reallocation away from paid ads (which averaged $310 CPL) toward content marketing ($92 CPL average) and LinkedIn organic approaches. June showed particular efficiency at $172 CPL, representing a 25.0% improvement from April’s $198, demonstrating that increased campaign optimization and refined targeting directly reduced acquisition costs.
Q3 Cost Mastery ($169.33 average): September’s $165 CPL represented an 8.5% reduction from Q2 and a 23.3% total improvement from January’s $215, demonstrating sustained efficiency gains. The September figure ranks among the lowest achievable for broad-based B2B lead generation, approaching the $92 content marketing benchmark while maintaining quality improvements.
Channel Distribution Transformation
Throughout 2025, the composition of lead sources fundamentally shifted, reflecting both strategic changes and performance-driven optimization.
Content Marketing Ascendance: January’s 28% contribution grew to 38% by September (+35.7% share gain). This reflects industry-wide recognition that 80% of B2B marketers rely on content marketing for lead generation, particularly when optimized for buyer journey stages. September’s performance confirmed that high-quality content attracts leads across all funnel stages without seasonal degradation.
To scale thought leadership and nurture programs without escalating ad spend, use our Inbound Marketing Services for topic clustering, journey mapping, and automated sequences that compound lead volume.
LinkedIn’s Consistent Strength: Holding steady at 22% in January and growing to 29% by September, LinkedIn demonstrated the reliability of direct professional networks for B2B prospecting. This aligns with data showing 82% of B2B marketers use LinkedIn for lead generation and 40% rate it as their most effective channel for high-quality leads.
Organic Search Stability: Growing from 18% to 26%, organic search demonstrated the enduring value of SEO. The growth reflected companies’ focus on optimizing for high-intent keywords and recognizing that SEO leads have 14.6% close rates compared to 1.7% for outbound efforts.
Email and Paid Ads Reallocation: Email declined from 15% to 5%, while paid ads virtually disappeared from the mix (12% to <1%). This shift indicates strategic decisions to replace expensive PPC ($310 average CPL) with proven inbound methods, as budget-conscious teams demonstrated that email marketing averages $53 per lead compared to paid ads’ escalating costs. To effectively navigate this shift and maximize ROI, understanding a comprehensive suite of proven inbound methods is critical for sustained lead generation.
Events/Webinars Strategic Decline: Falling from 5% to 1%, this reflects both summer disruption and shifting strategies away from event-dependent lead gen. However, industry data shows 73% of B2B marketers still consider webinars highly effective, suggesting companies may re-weight this channel in Q4 planning.
Year-to-Date Performance Summary: Nine-Month Achievements
Total Organic Leads Generated: 17,520 leads across nine months, averaging 1,947 monthly leads.
Quality Improvements: Average SQL conversion rate of 7.37%, representing a 41.7% improvement from January’s 5.2% baseline.
Cost Efficiency: Average CPL of $188.11, representing a 12.5% reduction from January’s $215 baseline.
Growth Trajectory:
- Q1-to-Q2 growth: +17.0%
- Q2-to-Q3 growth: +4.1%
- Full-year progression: +36.4% (January to September)
Key Trends Driving 2025 Performance
1. AI-Powered Personalization at Scale
The ProfitWell SaaS Market Report explicitly identified AI integration as the primary driver of Q2-Q3 recovery, with companies reporting that 79% of sales teams achieved improved profitability through AI adoption. In lead generation specifically, AI-enabled: predictive lead scoring, personalized email sequencing at scale, chatbot qualification of initial prospects, and behavioral prediction for optimal outreach timing.
SaaS and technical buyers respond best to product-led storytelling; our IT Marketing Services translate complex features into outcome-driven content that improves both SQL rate and CPL.
2. Omnichannel Integration
Despite channel consolidation around content and LinkedIn, integration improved significantly. Data shows omnichannel campaigns generated 40% higher response rates and 31% lower CPL compared to single-channel efforts. The lead channel charts reveal sophisticated coordination: content marketing attracts awareness, LinkedIn enables decision-maker targeting, and email nurtures progression—all coordinated through marketing automation.
3. Quality-Over-Quantity Discipline
The dramatic improvement in SQL conversion rates (76.9% annual improvement) while simultaneously reducing costs reflects conscious strategic choices to prioritize lead quality. Industry benchmarks confirm this pattern: 87% of B2B marketers see better ROI from Account-Based Marketing by focusing on fewer, higher-quality prospects. Companies increasingly use ICP (Ideal Customer Profile) alignment, lead scoring, and sales-marketing SLAs to ensure only truly qualified leads advance.
4. Content-Driven Inbound Transformation
Content marketing’s growth from 28% to 38% of lead sources reflects industry recognition that 85% of B2B marketers cite content as critical for lead generation, particularly when mapping content to buyer journey stages. The shift away from interruptive paid ads ($310 CPL) toward valuable educational content ($92 CPL) demonstrates both cost efficiency and alignment with buyer behavior.
5. Intent-Driven Targeting
September’s exceptional performance (+15.4% MoM) coincided with companies activating fiscal Q4 budgets, demonstrating that intent-based timing now drives results. Industry adoption of intent data platforms (used by companies tracking buyer signal data) enables identification of “in-market” prospects, improving response rates by 20-30% compared to broad targeting.
Challenges and Limitations
While 2025’s organic lead generation performance has been generally positive, several headwinds merit acknowledgment.
Economic Uncertainty Persistence: Although Q1’s tariff uncertainty resolved more quickly than anticipated, ongoing macro uncertainties periodically affected buyer purchasing confidence, as evidenced by August’s -7.1% seasonal decline.
Rising Competition in Paid Channels: The near-elimination of paid ads from channel mixes reflects not strategic preference alone but also escalating costs, with B2B companies reporting PPC costs reaching $310+ CPL while LinkedIn Ad CPL averages $150+. This cost escalation forces less-capitalized companies toward lower-CPL but slower-ROI organic methods.
Lead Quality Consistency Challenges: While SQL conversion rates improved dramatically, industry data shows only 20% of leads ultimately convert to customers, suggesting substantial ongoing friction in sales follow-up and lead nurturing. Additionally, 42% of B2B companies report lead quality as a top challenge, indicating inconsistent lead intake standards.
Summer Seasonality Resilience: Although August’s -7.1% decline was milder than historical patterns, Q3 demonstrated that seasonal effects remain material. Companies relying heavily on summer-sensitive channels (events, conferences) faced particular headwinds.
Strategic Recommendations for Q4 2025 and Beyond
Based on 2025’s performance trends, B2B companies should consider the following strategic initiatives:
- Accelerate Content Marketing Investment: Given content marketing’s 38% channel share, continued lead generation at $92 CPL, and September’s recovery, increased budget allocation to content development and distribution offers risk-adjusted returns. Particularly effective: topic clustering for SEO, thought leadership publishing, and buyer journey-mapped educational resources.
- Deepen LinkedIn Strategy Integration: LinkedIn’s consistent 25-29% contribution, combined with 82% marketer adoption and 40% effectiveness rating for quality leads, justifies expanded LinkedIn investment—including organic posting, Sales Navigator prospecting, and LinkedIn Ads for account-based marketing campaigns.
- Formalize Lead Quality Standards: SQL conversion improvements prove that quality-focused disciplines work. Establish clear MQL/SQL definitions, implement lead scoring aligned to buyer behavior, and conduct regular sales-marketing alignment reviews to maintain Q3’s 8.5% SQL conversion performance.
- Optimize for Intent Signals: September’s +15.4% performance suggests that capturing leads when buyers are actively “in-market” dramatically improves conversion. Invest in intent data platforms and behavioral trigger automation to identify high-propensity-to-buy windows.
- Reduce Paid Channel Dependence: The virtual elimination of paid ads reflects both cost escalation and channel maturation. For companies still heavily weighted toward paid, test gradual budget reallocation toward proven organic methods, particularly content marketing and LinkedIn organic outreach.
- Adopt AEO (Answer Engine Optimization) to increase AI-surface visibility and win more zero-click intent with machine-readable content.
Conclusion
B2B companies’ 2025 organic lead generation performance demonstrates a sector in transformation. Starting from Q1’s uncertain foundation (1,650 monthly leads, 5.2% SQL conversion, $215 CPL), the sector accelerated through Q2’s recovery (+17.0% volume growth, 42.9% quality improvement) and sustained Q3 momentum (+4.1% volume growth, 8.5% SQL conversion, $169 CPL). By September 2025, companies achieved 36.4% higher lead volume, 76.9% better conversion quality, and 23.3% lower acquisition costs compared to January—a combination that fundamentally improves marketing ROI and sales pipeline health.
The data reveals that 2025’s success stems not from tactical quick wins but from strategic discipline: prioritizing content marketing and LinkedIn over expensive paid channels, improving SQL conversion rates quarter by quarter, and sustaining a positive cost per lead trend that continues into Q4 projections; integrating AI for personalized engagement at scale, implementing quality-focused metrics and processes, and aligning marketing and sales around shared lead-quality standards. As B2B companies enter Q4 2025, evidence suggests that continuing these proven approaches while capitalizing on seasonal budget activation and holiday-period buyer research will drive continued momentum through year-end and lay the foundation for sustained 2026 growth.
If you want these 2025 outcomes faster, combine a quarterly Digital Marketing Audit with ongoing AEO Optimization and Inbound Marketing execution.
References
B2B Lead Generation Industry Trends & Benchmarks
- B2B Lead Generation Trends 2025 (Belkins)
- Lead Generation Trends 2025 (Martal)
- Ultimate Guide to B2B Lead Generation in 2025 (PepperInsight)
- Definitive Guide to B2B Lead Gen in 2025 (PepperInsight)
- Lead Generation Trends 2025 (Salespanel)
- Lead Generation Statistics (Martal)
- Lead Gen Trends [Wiley Library]
- B2B Lead Generation 2025 Report (Lacleo.ai PDF)
- Top 5 Lead Gen Trends 2025 (LinkedIn Pulse)
Statistical Data, Performance Benchmarks & Market Reports
- SaaS Market Report Q2 2025 (Paddle)
- Lead Generation Statistics (CropInk)
- Lead Management Statistics (CRMSide)
- Lead to Sale Conversion Stats (Amra & Elma)
- Why Month-Over-Month Growth Matters (Worxmate.ai)
- Month-over-Month Growth Rates (Amplitude)
- B2B Marketing Statistics (SeoProfy)
- Lead Generation Stats 2025 (SeoProfy)
- How Much Traffic Comes from Organic Search? (SEOInc)
- Lead Generation Statistics (Digital Silk)
- Conversion Rate by Industry (Ruler Analytics)
- Lead Generation Statistics (Databox)
- Lead Generation Stats (Exploding Topics)
- Organic Traffic Growth Stats 2025 (FireUS Marketing)
- SaaS Lead Generation Insights (Leads at Scale)
- Bureau Veritas Organic Revenue Growth (Euronext)
- Bureau Veritas Revenue Performance (STTinfo)
- Increase Organic Traffic 2025 (GetPassionfruit)
- B2B PPC 2025 ROI & Lead Quality Report (The Digital Bloom)
- Best B2B Lead Generation Agencies 2025 (Lead Spot)
Academic & Peer-Reviewed Research
- Hydrological Processes (Wiley Online Library)
- Efeitos do hipoestrogenismo (Revista FT)
- Probiotic Therapy (RMJ)
- JES Article (Oxford Academic)
- UPJOZ Journal Article (MBIMPH)
- International Medical Journal (IJMHSR)
- IJECC Journal Article
- Nutrition Reviews (Oxford Academic)
- BMJ Open Article
- CancerRes Abstract CT238
- Tandfonline Marketing Review
- Elsevier Marketing Research
- Elsevier Industrial Marketing Management
- Elsevier IMM
- Elsevier IMM (2022)
- JKLST Journal Download
- arXiv Preprint 2306.01785
- arXiv 2306.07464
- arXiv 2209.14250
- MDPI Applied Sciences
- PeerJ CS 2144
- Cambridge Core Article
- Earth Planets Space (SpringerOpen)
- Semantic Scholar Paper 1
- Media+Culure Journal Article
- Semantic Scholar Paper 2
- Semantic Scholar Paper 3
- Semantic Scholar Paper 4