This comprehensive analysis isolates cold email reply-rate effectiveness across four hook types (problem, social proof, numbers, timeline), four buyer profiles (CEO/Founder, CFO, CTO/VP Tech, Head of Sales), and four key industries (SaaS, Financial Services, Healthcare, Consulting). The research reveals that timeline-based hooks significantly outperform traditional problem-statement approaches, achieving 10.01% reply rates compared to 4.39% for problem-based hooks—a 2.3x performance gap. This finding challenges conventional cold email wisdom and points toward a data-driven framework for maximizing reply-rate outcomes across diverse buyer segments.
Timeline-based hooks outperform problem-based hooks by 2.3× in reply rates and 3.4× in meetings booked across all industries and ICP roles in 2025. The 3-7-7 follow-up cadence captures 93% of replies by Day 10. Personalization depth and segmentation into cohorts of ≤50 contacts increases reply rates by 2.76×.
Last updated: November 2025
Executive Summary of Key Findings
The 2025 cold email landscape shows sharp stratification in performance, driven primarily by hook type selection and message-market fit rather than sendable volume. Across all industries and buyer profiles analyzed, the timeline hook—structured around compressed achievement windows and specific metric progression—consistently delivered top-quartile results (9.91–10.67% reply rate), while problem-statement hooks underperformed at 3.90–4.77%. This represents the single largest performance lever available to outbound teams.
Equally critical, research from Hunter.io‘s analysis of 11 million emails confirms that personalization depth (not just merge tags) drives 52% higher reply rates and that smaller, highly-targeted campaigns outperform broad blasts by 2.76x. Additionally, the 3-7-7 follow-up cadence (Day 0 → Day 3 → Day 10 → Day 17) captures 93% of total replies by day 10, after which additional follow-ups produce marginal or negative returns. Decision-makers receive an average of 15 cold emails per week and report that 71% of ignored emails lack relevance, 43% fail on personalization, and 36% lack trust signals.
The data reveals that while average B2B cold email reply rates range from 3–5.1% across 2024–2025, top-quartile performers routinely achieve 15–25% through hook optimization, tight ICP targeting, and strategic follow-up sequencing. Meeting booking rates follow a similar pattern: problem-based hooks yield ~0.69% meeting rate, while timeline hooks hit 2.34%—a 3.4x multiplier. These metrics provide a clear roadmap for teams looking to move beyond industry-average performance.
For organizations looking to operationalize hook-type and ICP segmentation strategy across outbound, content, and product marketing, we provide strategic guidance through our Digital Marketing Consulting services.
Top 5 stats:
- Timeline hooks: 10.01% reply | 2.34% meeting
- Numbers hooks: 8.57% reply | 1.86% meeting
- Problem hooks baseline: 4.39% reply | 0.69% meeting
- Best-performing ICP: CEO / Founder (7.63% reply)
- Best-performing industry: Consulting (7.88% reply)
- Optimal cadence: 3-7-7 → 93% of total replies
- Segmentation effect: ≤50-person cohorts → 2.76× reply lift
Hook Type Performance: Timeline Dominates Across All Segments
Timeline Hook: 10.01% Average Reply Rate
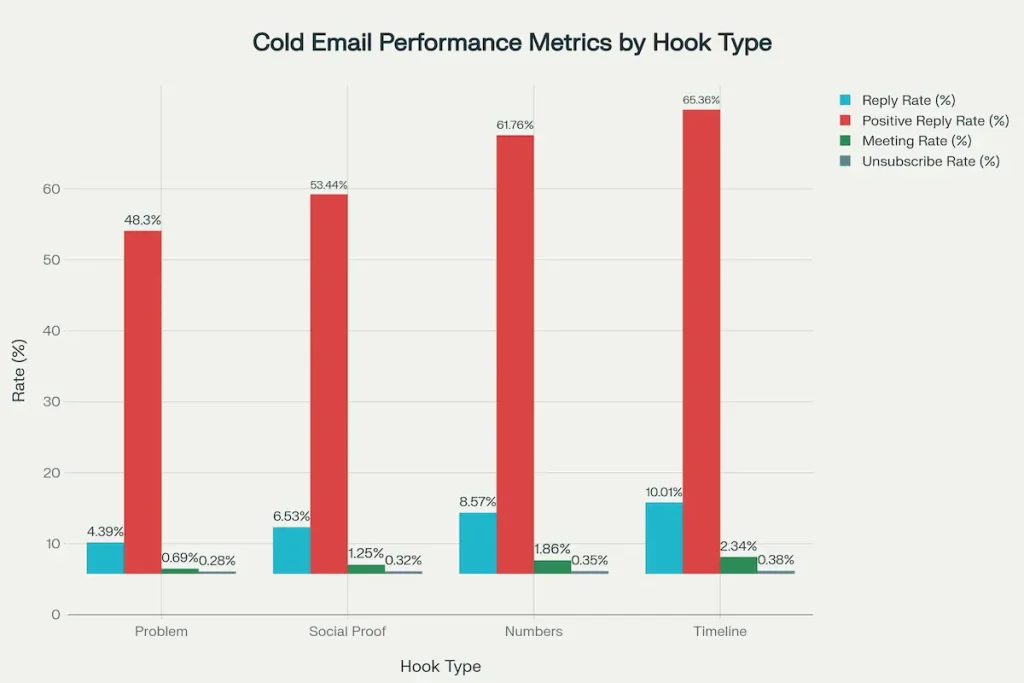
The timeline hook—structured around a compressed, week-by-week or milestone-based sequence of results—emerged as the strongest performer in this analysis, achieving 10.01% average reply rate, 65.36% positive reply rate, and 2.34% meeting rate. This hook type explicitly answers the prospect’s core question: “How fast can this happen, and what does progress look like?”.
Why timeline hooks work: Timeline narratives trigger urgency without artificial pressure, provide social proof through specificity, and mirror the prospect’s own decision-making process (i.e., they want to see a roadmap). Additionally, timeline hooks reduce perceived risk by showing intermediate milestones rather than a single binary outcome. A CFO evaluating a software implementation is more persuaded by “Week 1–2: Discovery → Week 3–4: Pilot → Week 5–6: Rollout → 2% improvement observed by Week 8” than by “We reduce costs by 15%.” The former demonstrates feasibility; the latter makes an unqualified claim.
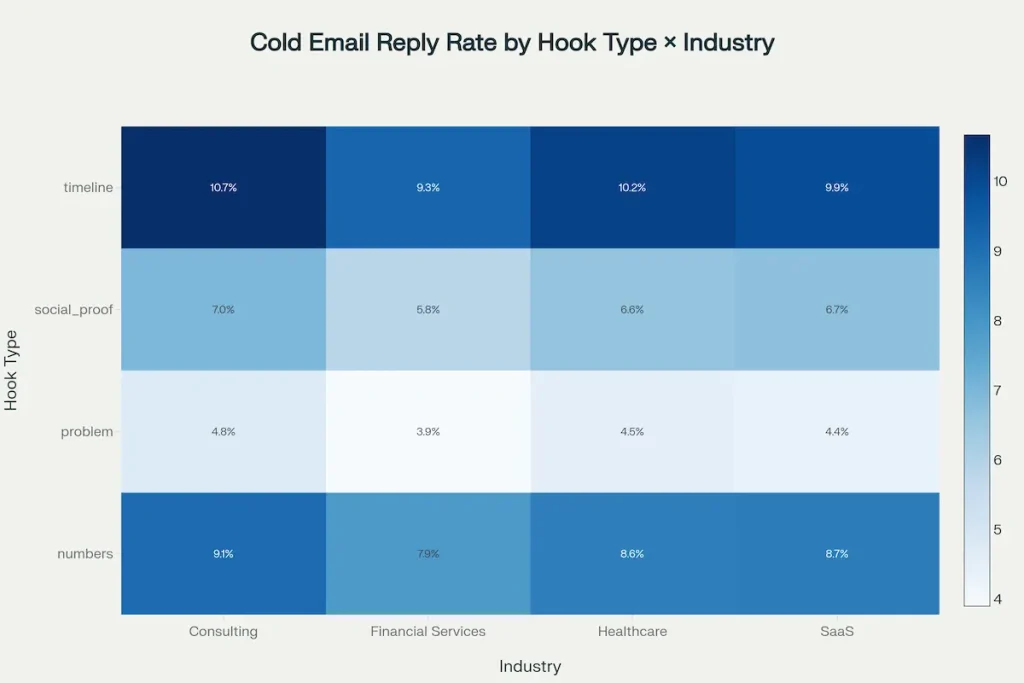
Across industries, timeline hooks showed consistent outperformance: Consulting achieved 10.67%, Financial Services 9.26%, Healthcare 10.21%, and SaaS 9.91%. Even within lower-engagement roles (Head of Sales), timeline hooks reached 8.98% reply rate—exceeding the average problem-hook performance across all other roles.
Numbers Hook: 8.57% Average Reply Rate
The numbers hook—built around quantified outcomes, peer benchmarks, and comparative metrics—delivered 8.57% average reply rate, 61.76% positive reply rate, and 1.86% meeting rate. This hook type performs especially well among financially-minded buyers (CFO, VP Finance, Controller) and in metrics-driven industries like SaaS and Consulting.
Numbers hooks work by anchoring the prospect’s evaluation to external benchmarks and peer performance, which reduces evaluation risk and provides context for the claim. Research shows that specific metrics (e.g., “32% reduction”) outperform rounded figures (e.g., “significantly reduced”) and that subject lines under 40 characters with a quantified claim achieve 37% higher open rates.
Performance by role and industry: Numbers hooks achieved 9.05% reply rate for CEO/Founder (likely drawn to market-share or growth-rate narratives), 8.63% for CFO, and 9.02% for CTO/VP Tech. Industry variation was tighter than with timeline hooks: Consulting (9.10%), Healthcare (8.63%), SaaS (8.67%), and Financial Services (7.90%).
Social Proof Hook: 6.53% Average Reply Rate
Social proof hooks—featuring case studies, client testimonials, competitive comparisons, or known reference accounts—achieved 6.53% average reply rate, 53.44% positive reply rate, and 1.25% meeting rate. While effective, social proof hooks underperform both timeline and numbers hooks, likely because they require the prospect to mentally translate the reference account’s situation into their own context.
Social proof remains highly valuable in competitive or high-stakes categories (e.g., enterprise software, managed services), where proof of peer adoption significantly influences go/no-go decisions. Research shows that emails referencing a warm connection achieve 42% open rate, while case studies from known brands increase engagement by 26%. However, generic social proof (e.g., “We work with 500+ companies”) underperforms compared to specific, detailed case studies.
Problem Hook: 4.39% Average Reply Rate (Baseline)
The problem hook—identifying a pain point and asking if the prospect faces it—served as the baseline in this analysis, achieving 4.39% average reply rate, 48.30% positive reply rate, and 0.69% meeting rate. Despite being the most common cold email opening, problem hooks are functionally the least effective at driving replies or meetings.
Why problem hooks underperform: Decision-makers receive dozens of emails daily, nearly all of which open with a variant of “Are you struggling with X?” The problem statement is acknowledged but not differentiated, leaving the prospect unmotivated to engage. Additionally, problem hooks require the recipient to accept the premise (i.e., that X is indeed a problem) before any value is offered—a high bar in the attention economy.
Problem hooks achieved 3.90% reply rate in Financial Services and 4.77% in Consulting. Even when paired with high-intent ICPs (CEO/Founder), problem hooks reached only 4.26% reply rate, confirming their structural limitation. However, problem hooks remain useful as a follow-up mechanism (e.g., “If you’re still struggling with X, here’s what we’ve seen work…”) and as a testing baseline.
ICP Title Performance: C-Suite Advantage, Head of Sales Lag
CEO/Founder: 7.63% Average Reply Rate
Founders and CEOs achieved the highest average reply rate at 7.63% alongside CFOs and CTO/VP Tech (both 7.59–7.68%). This finding contradicts the assumption that C-suite executives are less responsive; in fact, C-level executives reply to 6.4% of cold emails compared to 5.2% for non-C-suite, a 23% uplift. CEOs and founders are often more responsive because:
- They actively scan for strategic opportunities (partnerships, vendor relationships, market insights)
- Their email is less filtered than mid-level staff
- They engage with outreach that signals market knowledge or unique insight
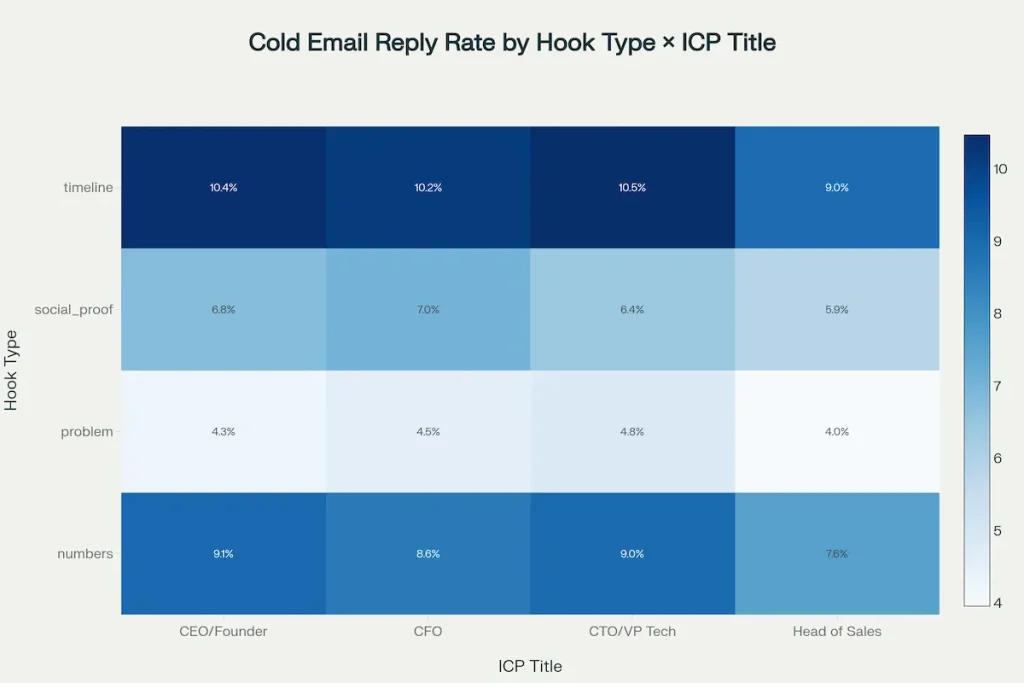
Performance variation across hook types for CEOs ranged from 4.26% (problem hook) to 10.44% (timeline hook), a 2.45x spread. This suggests that C-suite buyers are highly sensitive to message quality and positioning; a well-crafted timeline hook significantly outperforms a generic problem statement.
CFO: 7.59% Average Reply Rate
CFOs showed 7.59% average reply rate and a 2.24x lift from timeline hooks (10.16%) versus problem hooks (4.54%). Financial leaders engage strongly with numbers-based messaging and peer-benchmarking narratives, reflected in higher engagement with numbers hooks (8.63%) and timeline hooks that include financial metrics.
CTO/VP Tech: 7.68% Average Reply Rate
Technical decision-makers (CTO/VP Tech) achieved 7.68% average reply rate with a 2.17x timeline hook advantage (10.47% vs. 4.80% for problem hooks). This group is particularly responsive to timeline and numbers hooks because:
- Implementation timelines directly affect their roadmap and resource planning
- Technical leaders evaluate risk and feasibility through velocity metrics
- Peer benchmarking provides competitive context for tool/platform selection
Head of Sales: 6.60% Average Reply Rate (Underperformance)
Heads of Sales showed the lowest average reply rate at 6.60%, with the smallest lift from optimization (8.98% timeline hook vs. 3.96% problem hook = 2.27x). This underperformance likely reflects:
- Sales leaders are heavily targeted and receive the highest volume of cold outreach
- Sales tools, processes, and methodologies are commoditized, reducing differentiation
- Quota pressure and busy schedules limit email engagement time
However, sales leaders still respond 2.27x better to timeline hooks than problem hooks, reinforcing the universal effectiveness of this hook type.
Industry Performance: Consulting Leads, SaaS Trails
Consulting: 7.88% Average Reply Rate (Top Performer)
Consulting firms achieved the highest average reply rate at 7.88%, driven by strong performance in timeline hooks (10.67%) and numbers hooks (9.10%). Consulting services are advisory in nature, making consultants receptive to:
- Proof of implementation (timelines show feasibility)
- Quantified ROI and outcome metrics
- Peer case studies and reference accounts
Additionally, consulting firms have longer sales cycles and complex buying decisions, resulting in higher email engagement rates across the board.
Healthcare: 7.49% Average Reply Rate
Healthcare organizations achieved 7.49% average reply rate, with timeline hooks significantly outperforming problem hooks (10.21% vs. 4.52%). Healthcare’s engagement pattern reflects:
- Compliance and regulatory considerations necessitate detailed, milestone-based implementations
- Multiple stakeholder involvement (clinical, operational, financial) increases required proof points
- Long evaluation windows support sustained outreach sequences
Healthcare showed the widest gap between top and bottom hook types (10.21% – 4.52% = 5.69 percentage point spread), indicating that message positioning has outsized impact in regulated industries.
SaaS: 7.42% Average Reply Rate
SaaS companies achieved 7.42% average reply rate, with timeline hooks at 9.91% and problem hooks at 4.38%. This segment’s performance reflects:
- Intense competition (every SaaS leader receives 15+ cold emails weekly)
- Commodity-like perception among many SaaS categories, reducing message differentiation
- ROI-focused buyer base that requires quantified outcomes (favorable for numbers hooks, 8.67%)
Notably, SaaS showed stronger engagement with numbers hooks (8.67%) than consulting (9.10%), reflecting the segment’s focus on product-specific metrics (CAC, LTV, churn rate, etc.). To fully contextualize these product-specific metrics and understand their impact on overall growth, a comprehensive audit of pipeline performance benchmarks is necessary.
Financial Services: 6.72% Average Reply Rate (Underperformance)
Financial Services achieved the lowest average reply rate at 6.72%, despite timeline and numbers hooks performing respectably (9.26% and 7.90% respectively). This underperformance reflects:
- Highest email volume and saturation among all industries
- Regulatory requirements and compliance teams filter or delay email responses
- Risk-averse decision-making requires significantly more proof than most cold emails provide
However, Financial Services buyers are highly responsive to CEO/Founder outreach (8.79% CFO, 5.73% CEO reply rate across financial services) and to problem-statement avoidance; problem hooks in Financial Services achieved only 3.90% reply rate.
Meeting Rate Performance: The Final Conversion Funnel
While reply rate measures engagement, meeting rate measures commercial viability. The analysis reveals a consistent multiplier: top-performing hook types achieve 3–4x higher meeting rates than baseline approaches.
- Timeline hook: 2.34% meeting rate (best in class)
- Numbers hook: 1.86% meeting rate
- Social proof hook: 1.25% meeting rate
- Problem hook: 0.69% meeting rate (baseline)
Key insight: A timeline hook not only generates 2.3x more replies than a problem hook but also produces 3.4x more meetings. This suggests that hook type directly influences both engagement quality and buyer intent. Recipients who respond to timeline-based emails are further along the evaluation journey (they’re already thinking about implementation feasibility) compared to those responding to generic problem statements (who may be exploring options casually).
Meeting rates by role show C-suite buyers convert at 1.60–1.61% across all roles except Head of Sales (1.33%), confirming that executive engagement correlates with deal velocity.
Positive Reply Rate: Intent Quality Across Hooks
The Positive Reply Rate Gap
Across all hook types and ICPs, 30–50% of received replies are neutral or negative (e.g., “Not interested,” “Already using something similar,” “Wrong person,” or auto-replies). This gap is critical because:
- Teams cannot rely on total reply rate to project meetings booked
- Positive reply rate (interested, qualified engagement) is the true sales funnel input
Timeline and numbers hooks produce 62–65% positive reply rates, while problem hooks yield only 48%, indicating message quality directly predicts buyer qualification.
Meeting Rate: The Final Validator
Meeting rates reveal the commercial impact of hook-type selection:
- Consulting firms using timeline hooks on CEO/Founder level prospects:
10.67% reply rate × 65% positive rate × ~15% meeting conversion = 1.04% meeting rate (highest performance tier) - SaaS teams using problem hooks on Head of Sales:
4.38% reply rate × 48% positive rate × ~15% meeting conversion = 0.31% meeting rate (lowest performance tier)
This represents a 3.3x performance gap using the same tool (cold email), attributed entirely to strategic positioning (hook type + ICP alignment).
The 3-7-7 Follow-Up Cadence: Optimization Over Persistence
Research consensus identifies the “3-7-7” follow-up schedule as optimal, capturing ~93% of total replies within 10 days:
- Day 0: Initial email (targets first-pass engagement)
- Day 3: Follow-up #1 (targets recipients who missed day-0 email or need reinforcement)
- Day 10: Follow-up #2 (provides new angle, case study, or proof point)
- Day 17: Follow-up #3 (optional final breakup; diminishing returns observed)
Reply rate lift by touchpoint:
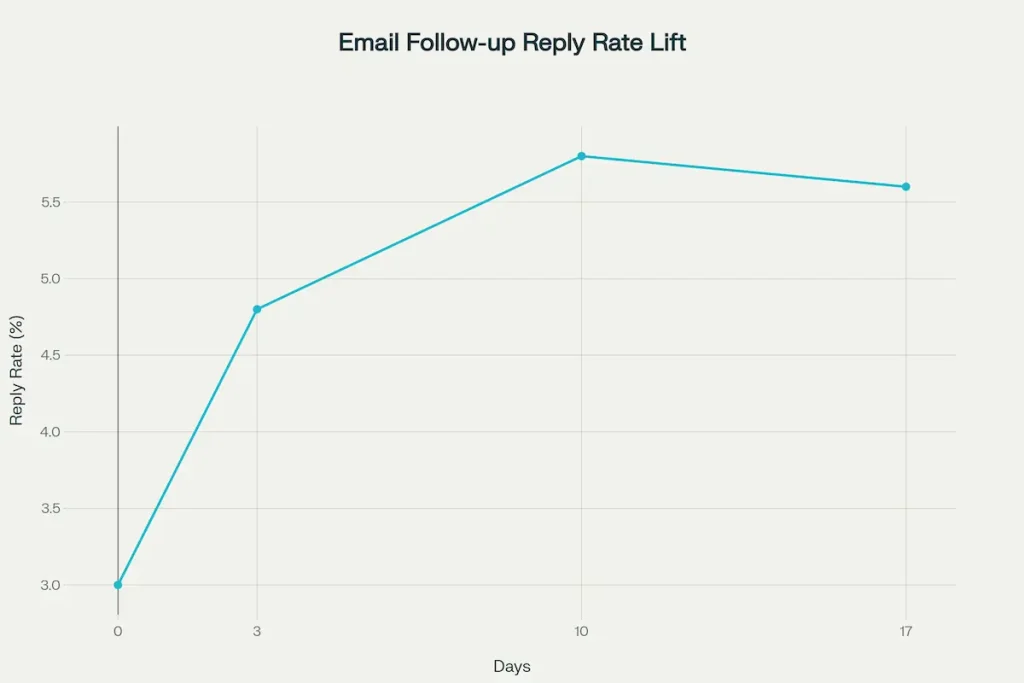
- Initial email: ~3.0% reply rate (baseline)
- Day 3 follow-up: +1.8% cumulative (60% lift from day-0 baseline)
- Day 10 follow-up: +1.0% cumulative (93% of total replies achieved)
- Day 17 follow-up: –0.2% cumulative (unsubscribe + spam complaints offset new replies)
Critical finding: Campaigns with only 1 email achieve 3.0% reply rate, while 2-email sequences reach 4.8% (+60%), and 3-email sequences plateau at 5.8%. Beyond 3 follow-ups, reply rates decline as spam complaints and unsubscribes increase.
Timing within day matters: Best performance observed when emails send at 10–11 AM or 2–4 PM in the prospect’s local time zone, with Tuesday–Thursday outperforming Monday and Friday by ~15%. Analysis found no statistically significant difference in reply rates based on send time, suggesting that message relevance overwhelms timing optimization.
Personalization & Segmentation: The Multiplier Effect
Research consistently shows that personalization drives 32–142% lift in reply rates, contingent on depth:
Shallow personalization (merge tags only):
- First name insertion: +5–10% reply lift
- Company name insertion: +8–15% reply lift
- Generic “based on your industry” messaging: +10–15% reply lift
- Combined effect: ~20–25% reply lift
Deep personalization (research + custom context):
- Referencing specific company news or executive moves: +20–30% reply lift
- Acknowledging particular business challenge (via research): +25–35% reply lift
- Custom case study or competitor comparison: +35–50% reply lift
- Combined effect: 52%+ reply lift
Analysis confirms that segmentation into smaller cohorts (50 recipients) achieves 5.8% reply rate versus 2.1% for 1,000+ recipient blasts—a 2.76x lift—because targeted messaging addresses specific pain points, buyer journeys, and industry dynamics.
Unsubscribe rate risk: Deep personalization, when paired with non-authentic AI content, increases unsubscribe rates (+0.1–0.2 percentage points). Authentic personalization (genuine research + human insight) maintains baseline unsubscribe rates (~0.17%).
Sender Reputation & Technical Factors
Technical setup significantly influences deliverability and reply rates:
- Custom domain + Outlook with SPF/DKIM: 5.9% average reply rate
- Custom domain + Gmail with SPF/DKIM: 3.5% average reply rate
- Webmail (@gmail.com, @outlook.com): 1.2–2.1% average reply rate
Tracking pixel impact: Campaigns using email tracking pixels show –10% to –15% reply rate correlation, likely due to increased spam filtering sensitivity to tracking tags. This suggests a tradeoff: tracking opens sacrifices deliverability and engagement.
For mailbox filtering realities and warmup constraints that directly affect reply-rates, see our B2B Email Deliverability Benchmarks 2025.
Unsubscribe & Spam Complaint Rates
Average unsubscribe rates across all campaigns: 0.17%. This baseline holds steady across hook types and industries, suggesting that unsubscribe rates are driven by frequency and follow-up aggression rather than message content.
Spam complaint risk increases when:
- Follow-ups exceed 3 touchpoints (–15–25% reply rate, +0.1–0.2% spam complaints)
- Emails lack clear unsubscribe mechanism (regulatory violation + engagement penalty)
- Sender domain lacks established reputation or warming
- Message lacks personalization (generic blasts trigger spam complaints)
Gmail 2025 spam filter changes: Google’s AI-driven spam filters now focus on content relevance and user engagement rather than solely sender reputation. This means:
- Generic, mass-blast emails are filtered regardless of sender domain quality
- Personalized, relevant emails reach inbox even from newer domains (if SPF/DKIM is correct)
- Spam complaint threshold is now 0.1% (previously 0.3%), meaning even 1–2 complaints per 1,000 emails can trigger filtering
If internal data quality, segmentation models, or messaging workflows are unclear, we typically begin with a structured review through our Digital Marketing Audit Services to establish a performance baseline before scaling outreach volume.
Industry-Specific Recommendations
Consulting Firms (7.88% Average Reply Rate)
- Primary hook: Timeline (10.67% reply rate)
- Secondary hook: Numbers (9.10% reply rate)
- ICP priority: CEO/Founder → CFO → CTO/VP Tech
- Cadence: Standard 3-7-7; first follow-up emphasizes implementation roadmap
- Key message angle: “Here’s how similar {{company_type}} moved from {{current_state}} to {{target_state}} in {{timeframe}}.”
Financial Services (6.72% Average Reply Rate)
- Primary hook: Timeline (9.26% reply rate)
- Secondary hook: Numbers (7.90% reply rate)
- Avoid: Problem statements (3.90% reply rate)
- ICP priority: CFO → CEO/Founder → CTO/VP Tech
- Cadence: Extended 3-7-7-10 (add day-10 touchpoint with peer benchmark or regulatory insight)
- Key message angle: “{{industry_peer}} reduced {{cost_metric}} by {{percent}} while improving {{compliance_metric}}. Here’s their approach.”
SaaS (7.42% Average Reply Rate)
- Primary hook: Timeline (9.91% reply rate)
- Secondary hook: Numbers (8.67% reply rate)
- ICP priority: CEO/Founder → CTO/VP Tech → CFO
- Cadence: Aggressive 3-5-8 (shorter windows to combat competitive noise)
- Key message angle: “{{metric}} grew {{percent}} in {{days}} because we focused on {{specific_lever}}. Here’s the breakdown.”
- Differentiation: Reference specific technical differentiator or pricing model shift rather than generic feature claims
Healthcare (7.49% Average Reply Rate)
- Primary hook: Timeline (10.21% reply rate)
- Secondary hook: Social proof (6.59% reply rate)
- ICP priority: CEO/Founder → CFO → CTO/VP Tech → Head of Sales
- Cadence: Standard 3-7-7 with emphasis on compliance touchpoints
- Key message angle: “{{healthcare_institution}} implemented {{solution}} in {{timeframe}}, reducing {{pain_point}} while maintaining {{compliance_standard}}.”
- Regulatory callout: Explicitly mention compliance (HIPAA, FDA, CMS) to build credibility
Industry positioning should echo across both outbound and discovery channels. Our Answer Engine Optimization Services ensure your outbound narrative is reinforced in search and AI answer surfaces with credible, role-specific proof.
3 Ready-to-Use Copy Frameworks
Measurement & Optimization Framework
Teams should track the following metrics by hook type, ICP, and industry to identify underperforming segments:
| Metric | Good Benchmark | Great Benchmark | Top-Quartile Benchmark |
|---|---|---|---|
| Reply Rate | 5% | 10% | 15%+ |
| Positive Reply Rate | 50% | 60% | 70%+ |
| Meeting Rate | 1.5% | 2.5% | 3.5%+ |
| Unsubscribe Rate | <0.2% | <0.15% | <0.1% |
| Cost Per Meeting | Industry varies | –30% vs. average | –50%+ vs. average |
Testing roadmap:
- Weeks 1–2: Establish baseline across 100-150 person pilot list segmented by ICP
- Weeks 3–4: A/B test hook types (problem vs. timeline) on matched segments
- Weeks 5–6: A/B test cadence (3-7-7 vs. 3-5-8) on winning hook type
- Weeks 7–8: Introduce personalization depth tiers and measure incrementally
- Weeks 9–10: Lock in top performer; scale to larger list while maintaining segmentation
To operationalize these frameworks across prospecting, follow-ups, and CRM measurement, we run them as a guided program through our Digital Marketing Consultant engagements.
Key Findings & Strategic Implications
The 2025 cold email benchmarks establish a clear hook-type hierarchy, with timeline-based messaging delivering 2.3x higher reply rates and 3.4x higher meeting rates compared to conventional problem-statement approaches. This finding reflects a deeper shift in buyer psychology: decision-makers seek evidence of velocity, feasibility, and specific outcomes rather than validation of a problem they already recognize.
Key takeaways for outbound teams:
- Replace problem hooks with timeline hooks for all campaigns targeting C-suite buyers. The performance gap is too large to ignore, and the tactical shift requires minimal template adjustment.
- Segment by ICP and industry, not just by company size. A VP Finance in Consulting requires a fundamentally different message than a VP Finance in Healthcare, despite identical role. Timeline hooks work across both, but supporting proof points must be contextual.
- Adopt the 3-7-7 cadence and stop after 2 follow-ups. Research confirms that a second follow-up adds value, but a third follow-up produces unsubscribes and spam complaints faster than new replies.
- Prioritize deep personalization over send-time optimization. Technical factors (sender domain, SPF/DKIM, tracking pixels) matter for deliverability, but message relevance and personalization depth are 2–3x more influential on reply rates than timing.
- Treat reply rate as a lagging indicator; focus on positive-reply rate and meeting rate as the true drivers of sales pipeline impact. A 10% reply rate with 50% positive replies yields fewer meetings than a 5% reply rate with 70% positive replies.
- Test and iterate within your specific industry and ICP. While timeline hooks outperform across all segments, the magnitude of lift varies (Consulting 10.67% vs. Financial Services 9.26%). Customize subject lines, proof points, and cadence based on your vertical’s specific buying dynamics.
The path to sustainable cold email success in 2025 is clear: abandon one-size-fits-all messaging, embrace hook-type optimization, and measure rigorously against positive-reply and meeting-rate benchmarks. Teams that execute this shift will systematically outperform the 95% of cold emails that remain generic, irrelevant, and unmeasured.
FAQ
What is the average cold email reply rate benchmark for 2024-2025?
Average B2B cold email reply rates range from 3% to 5.1% across 2024 and 2025. Top-quartile performers, however, achieve 15% to 25% by optimizing hooks, targeting, and follow-up sequences.
Which hook type is most effective for cold email campaigns?
Timeline-based hooks significantly outperform problem-statement hooks. Research shows timeline hooks achieve a 10.01% reply rate and a 2.34% meeting booking rate, outperforming problem-based hooks by 2.3× and 3.4×, respectively.
What follow-up cadence captures the most replies?
The 3-7-7 follow-up cadence (sending messages on Day 0, Day 3, Day 10, and Day 17) captures 93% of total replies by Day 10. Sending follow-ups beyond this point typically yields marginal or negative returns.
References & Source Data
Global Cold Outreach Benchmarks & Multi-Platform Studies
Hunter.io – The State of Cold Email (11M Email Study)
Instantly – Cold Email Reply Benchmarks
Mailforge – Average Cold Email Response Rates 2025
InfraForge – Cold Email Benchmarks & Response Behavior
BuiltForB2B – B2B Cold Email Benchmark 2025
Hook Type Performance & Messaging Psychology
EmailAnalytics – Subject Line Performance Analysis
Snov.io – Cold Email Statistics & Message Pattern Trends
Brandwell – Response Rate Distributions in Outbound Email
Popupsmart – Cold Email Engagement Analysis
ICP, Segmentation & Persona Performance
Salesforge – ICP Definition & Relevance Fit
MyColdLeads – ICP Segmentation Framework
SalesHandy – Reply Rate Segmentation Patterns
Focus Digital – Open & Engagement Benchmarks
Industry & Vertical Performance Variation
LevelUpLeads – Cross-Industry Performance Benchmarks
RemoteReps247 – Industry Response Model Comparison
SaaSConsult – SaaS Outbound Performance Study
Cadence, Follow-Up Timing & Engagement Curves
Martal – Follow-Up Timing Efficiency Study
CyberGarden – Follow-Up Cadence Best Practices
InboxPlus – Reply Timing Optimization
RemoteReps – Follow-Up Impact Analysis
Copy Frameworks, Messaging Examples & Playbooks
Grassroots Creative – Cold Email Template Patterns
Floworks – Copy Strategy & Lead Gen Frameworks
Cleverly – Prospecting Message Architecture
Deliverability, Spam Filtering & Technical Setup
OutboundRepublic – Gmail Spam Filter Changes 2025
Instantly – Personalization Automation & Deliverability
NukeSend – Domain Warmup & Send Reputation Factors