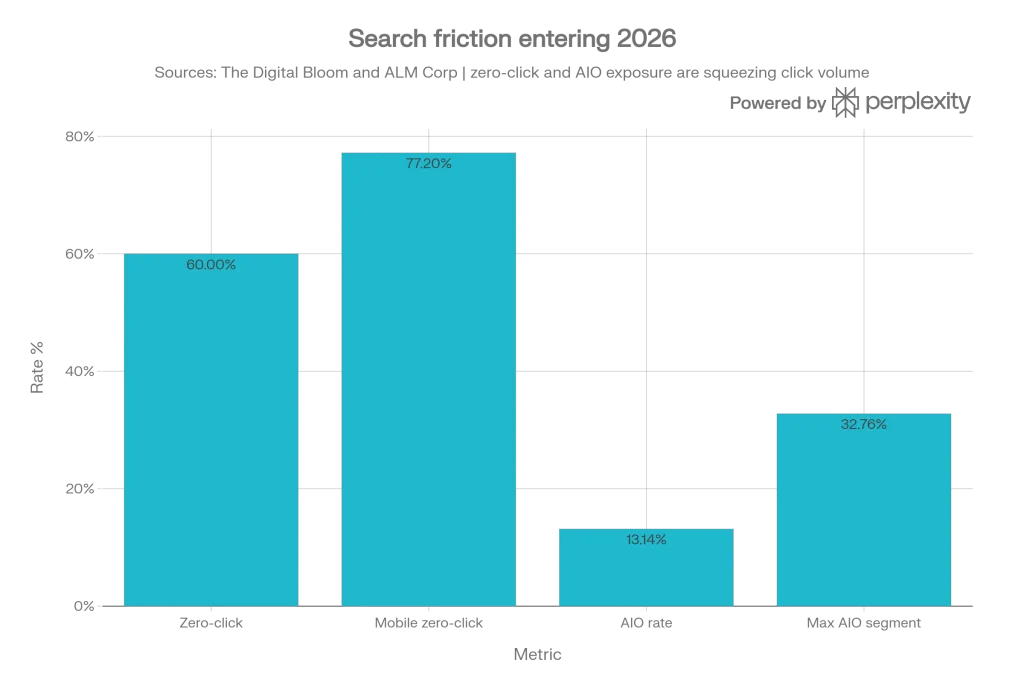
Search traffic did not vanish. The click path got worse. Search Engine Land’s January 2026 coverage of Graphite data found U.S. organic search traffic down 2.5% year over year, which is a real decline but nowhere near the apocalypse version of the story. At the same time, our 2025 analysis put zero-click searches at 60%, mobile zero-click behavior at 77%, and AI Overview appearance at 13.14% of queries. ALM Corp then pushed the picture further, showing organic click share down 11 to 23 percentage points across multiple verticals between January 2025 and January 2026.
That is what this report is about. Not lazy “SEO is dead” drama. Not soothing nonsense either. The useful question is simpler: where are the clicks going, who is losing them first, which content still earns a visit, and what should a B2B team do in the next 90 days?
The short answer is that search demand still exists, but a larger share of value now gets absorbed by AI summaries, zero-click behavior, and paid surfaces before the user ever reaches your site.
TL;DR summary
- Traffic trend: U.S. organic search traffic was down 2.5% YoY in Graphite data covered by Search Engine Land.
- Zero-click baseline: 60% of searches ended without a click, and mobile zero-click behavior reached 77%.
- AI Overview spread: AI Overviews appeared in 13.14% of queries in The Digital Bloom’s dataset and reached category-level presence as high as 32.76% in ALM Corp’s analysis.
- CTR damage: Organic CTR was 0.61% with AI Overviews present versus 1.62% without them.
- Who gets squeezed: The top 10 sites grew about 1.6%, while the sharpest declines hit sites ranked roughly between the top 100 and 10,000.
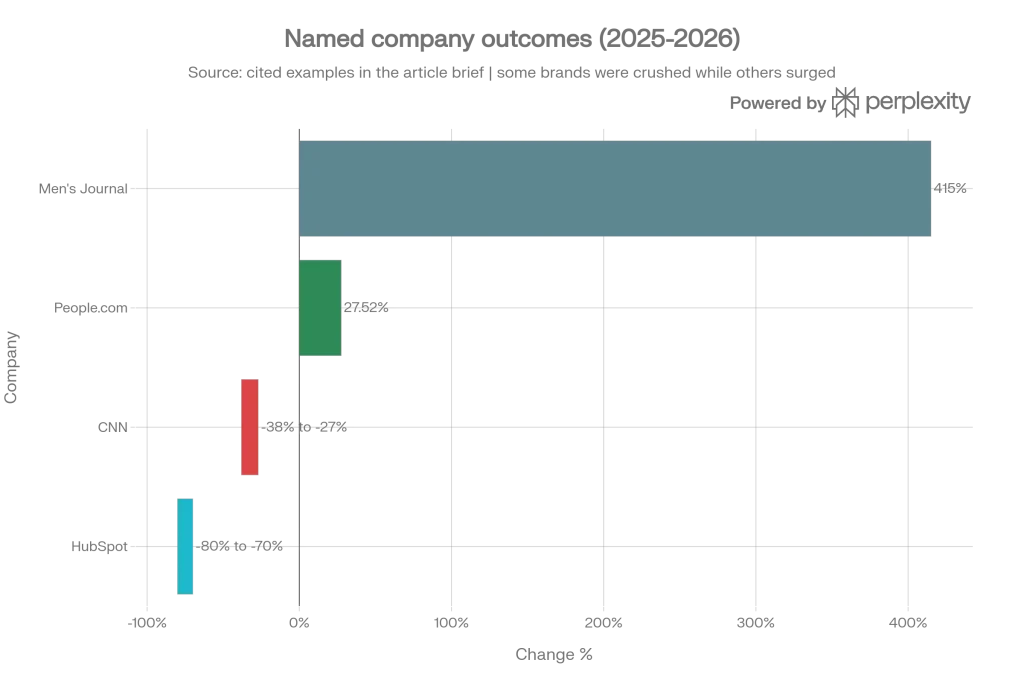
- Big brand warning: HubSpot was cited at -70% to -80%, while People.com was up 27% and Men’s Journal was up 415%.
- Main takeaway: Search demand is still there. The clicks are getting redistributed.
Quick summary: If you still judge SEO mostly through sessions, you are measuring the symptom, not the structural change.
Executive summary
The number that matters most here is not 2.5%. It is the combination. A modest market-level traffic decline by itself would be manageable. Pair it with 60% zero-click behavior, 77% mobile zero-click behavior, AI Overview expansion from 6.49% to 13.14%, and weaker CTR on both AIO and non-AIO queries, and the economics of search look very different.
That is why so many teams feel like their reports and their intuition no longer match. Rankings may hold. Impressions may stay stable. Traffic still slips. The old assumption was simple: visibility creates clicks, clicks create visits, visits create opportunity. That chain still works sometimes. It just breaks more often now.
| Metric | Baseline | Current benchmark | Change | Implication |
| U.S. organic traffic | Prior year | -2.5% YoY | Down | Pressure is real, but “collapse” is sloppy analysis |
| Zero-click searches | 58% | 60% | Up | More search intent resolves before the visit |
| Mobile zero-click | n/a | 77% | High | Mobile informational traffic looks more fragile |
| AI Overview appearance | 6.49% | 13.14% | Up 102% | More queries lose clean organic click space |
| Organic CTR with AIO | 1.76% | 0.61% | Down 61% | Ranking alone no longer predicts traffic output |
| Organic CTR without AIO | 2.74% | 1.62% | Down 41% | The behavior shift is broader than AIO alone |
| Size effect | n/a | Top 10 sites up 1.6% | Up | Brand and entity strength still buy protection |
👉 Audit tip: Check Search Console before you touch content. If clicks fell while impressions stayed flat, you are probably looking at click compression rather than disappearing demand.
Why this is a click-distribution problem
TL;DR:
- Search Engine Land reported organic traffic down 2.5% YoY.
- In our report, we cited daily Google searches at 9.1 to 13.6 billion.
- Zero-click behavior reached 60%, with mobile at 77%.
- Search demand stayed large while visits to websites got harder to win.
At The Digital Bloom we called it “The Great Decoupling.” Search activity remains huge. Clicks to websites have weakened. Those two facts can sit next to each other without contradiction.
In our previous research, we estimated Google at 9.1 to 13.6 billion daily searches in 2025 while also documenting 60% zero-click behavior and a doubling in AI Overview appearance. With search intent increasingly resolved on the SERP, the impact of AI tools on the buyer journey becomes a critical strategic pivot for teams aiming to capture value beyond the click. Search Engine Land’s reporting on Graphite data then showed only a 2.5% year-over-year traffic decline at market level, which sounds mild until you remember that traffic was already being redistributed away from many mid-tier sites.
That is why “is search dying?” is the wrong argument. Search is not dying. The old route from query to click is becoming less reliable. Some searches resolve on the page. Some get pulled into AI summaries. Some still click through, but with lower frequency than before.
Search demand versus click output
| Signal | Benchmark | What it tells you |
| Daily Google searches | 9.1 to 13.6B | Search activity remains huge |
| U.S. organic traffic trend | -2.5% YoY | Visits softened, but the channel did not implode |
| Zero-click rate | 60% | More searches end on-platform |
| Mobile zero-click rate | 77% | Mobile TOFU traffic is more exposed |
| AIO appearance rate | 13.14% | More results pages satisfy intent directly |
HubSpot is still the clearest warning sign. We cited the company at -70% to -80% in organic traffic after building a huge amount of broad top-of-funnel content with weak connection to its core product. That does not mean every educational library is doomed. It means the generic educational scale has become much easier to compress into a summary layer.
🧠 Quick takeaway: When impressions hold but clicks fall, stop asking whether demand vanished. Ask whether the interface absorbed more of the intent before the user needed your page.
Who gets hit first
TL;DR:
- The top 10 sites grew about 1.6%, while the sharpest declines hit sites ranked roughly between the top 100 and 10,000.
- Median publisher traffic was down 10% in The Digital Bloom’s analysis.
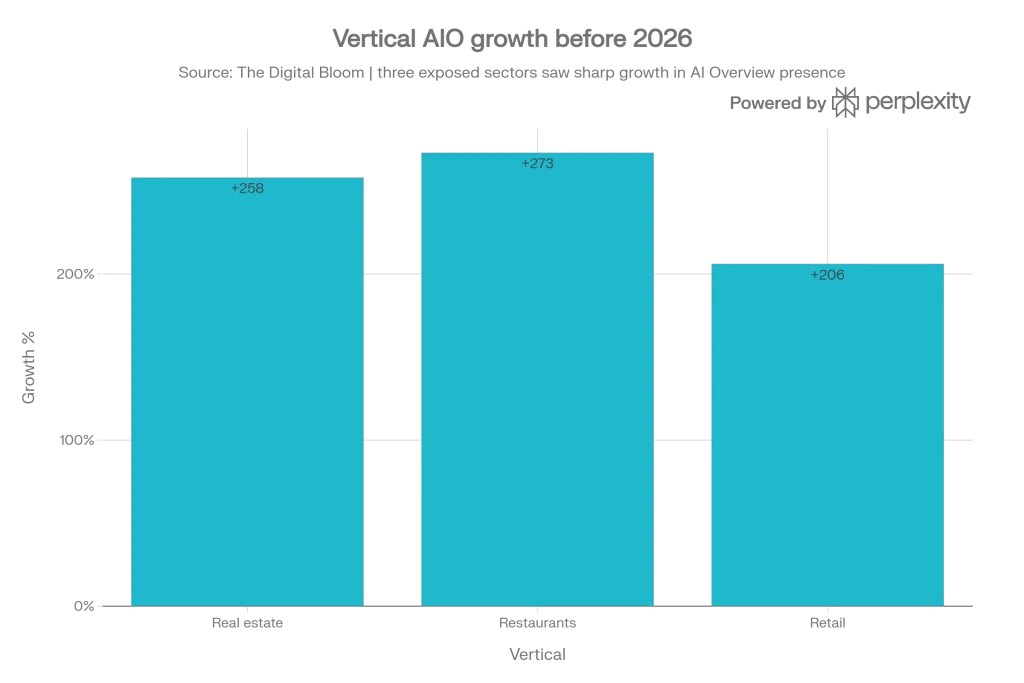
- AI Overview growth reached 258% in real estate, 273% in restaurants, and 206% in retail.
- The problem is uneven, which makes generic SEO advice mostly useless.
One of the dumbest habits in SEO writing is talking about “sites” as if they all face the same market. They do not. Search Engine Land’s Graphite coverage made that clear: the largest properties still grew, with the top 10 up about 1.6%, while declines concentrated among sites ranked roughly between the top 100 and 10,000.
That tracks with what you would expect. Brand strength, direct navigation, and entity recognition all matter more when results pages get crowded. Large sites have more cushion. Mid-tier sites do not. They are strong enough to compete, but not strong enough to shrug off click compression.
Industry effects stack on top of that. The Digital Bloom reported AI Overview growth at 258% in real estate, 273% in restaurants, and 206% in retail between January and March 2025. It also cited median publisher traffic down 10% year over year. Those are exactly the kinds of segments where informational discovery has historically mattered most, so the pain shows up early and loudly.
Segment benchmark table
| Segment | Benchmark | Exposure level | First move |
| Top 10 sites | +1.6% | Lower | Defend brand and entity strength |
| Top 100 to 10,000 | Declines concentrated here | High | Segment by intent and cut weak assets |
| Publishers | Median traffic down 10% | High | Reduce dependence on generic pageview content |
| Real estate | AIO growth 258% | High | Shift toward conversion-ready content |
| Restaurants | AIO growth 273% | High | Tighten local and action-oriented pages |
| Retail | AIO growth 206% | Medium-high | Protect comparison and commercial pages |
✅ Practical benchmark: If your site sits outside the top 10 and more than half of your non-branded traffic comes from informational content, assume above-average exposure until your own query-level data proves otherwise.
Every page can rank higher. We show you exactly how.
RankBloom, the page-by-page SEO audit tool, diagnoses every page on your site, then tells you what to fix, how to fix it, and where to start. Orphan pages, weak anchors, keyword gaps, spam signals – and more.
How paid ads and AI Overviews shrink the click pool
TL;DR:
- ALM Corp reported organic share declines of 11 to 23 percentage points across analyzed verticals.
- The same analysis found text ads gaining 7 to 13 points.
- Organic CTR was 0.61% with AI Overviews versus 1.62% without them.
- Even non-AIO queries got weaker, which means the shift is broader than one SERP feature.
This is where the whole thing stops sounding abstract. ALM Corp’s February 2026 analysis found classic organic click share down between 11 and 23 percentage points across every vertical it measured. At the same time, text ads gained 7 to 13 points in every category. Search Engine Land summarized the same trend by saying paid click share had doubled as organic clicks fell.
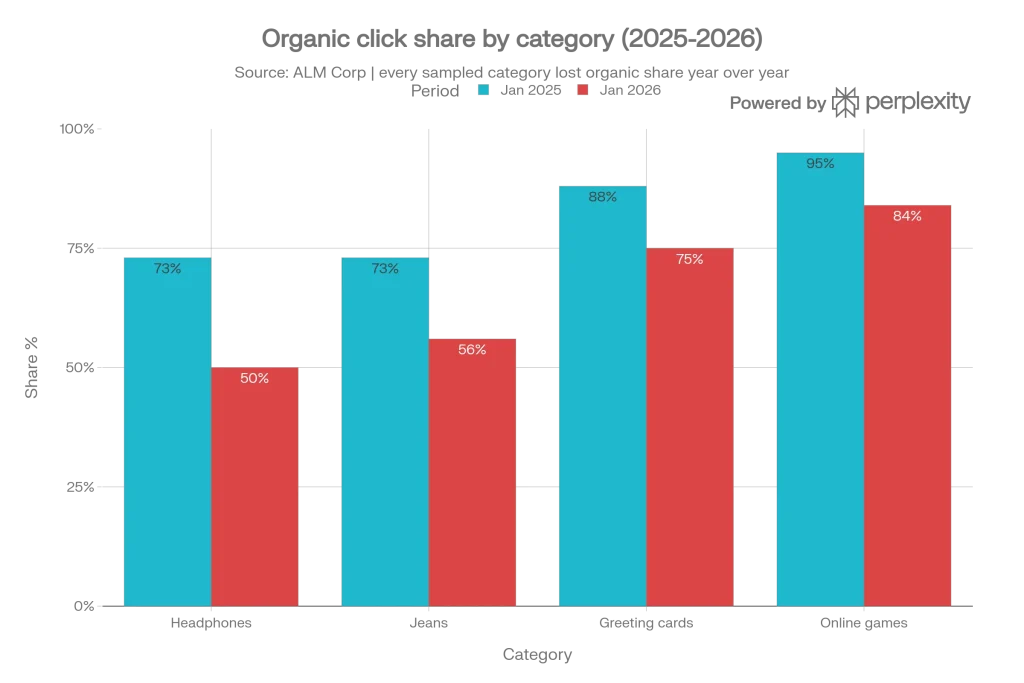
The category-level examples are rough. Headphones fell from 73% organic click share to 50%. Jeans dropped from 73% to 56%. Greeting cards fell from 88% to 75%. Online games went from 95% to 84%. That is not a small drift. That is a new market structure.
Then come the CTR numbers. ALM Corp cited organic CTR at 0.61% when AI Overviews were present versus 1.62% without them. That matters because it means you cannot blame the whole problem on AIO presence and move on. User behavior is changing more broadly than that.
Click-share benchmark table
| Metric | Previous state | Current state | Change | Implication |
| Headphones organic share | 73% | 50% | Down | Product discovery got more crowded |
| Jeans organic share | 73% | 56% | Down | Commercial SERPs behave differently now |
| Greeting cards organic share | 88% | 75% | Down | Even high-organic categories lost ground |
| Online games organic share | 95% | 84% | Down | Organic-heavy sectors are not protected |
| Organic CTR with AIO | 1.76% | 0.61% | Down 61% | AI answers reduce click demand sharply |
| Organic CTR without AIO | 2.74% | 1.62% | Down 41% | The decline extends beyond AIO queries |
Citation still matters
ALM Corp also reported a 35% higher organic CTR and a 91% higher paid CTR when brands were cited in AI Overviews. That does not mean citation is magic. It does mean cited visibility belongs in your reporting stack now.
Amazon, Walmart, Bose, Gap, and CrazyGames all show up in ALM Corp’s examples of brands increasing paid investment while losing or defending organic share. The pattern is obvious and a little bleak: many brands are buying back part of the traffic they used to get for free.
📈 Action: Split your reporting into two views right now: AIO-exposed queries and non-AIO queries. If you lump them together, you will misread both CTR and payback.
Which B2B content models still hold up
TL;DR:
- HubSpot was cited at -70% to -80%.
- People.com was up 27%, and Men’s Journal was up 415%.
- Broad TOFU libraries look weaker than product-led education, comparison pages, and utility assets.
- The useful question is not whether the content is “good.” It is whether the user still needs to click it.
This is the part B2B teams should actually care about. Not the slogans. The content model. What still deserves a budget when the click pool keeps shrinking?
Broad top-of-funnel libraries look weaker now, especially when they target generic educational demand with little product adjacency. HubSpot is the obvious warning because the drop was so severe and so public. The Digital Bloom cited the company at -70% to -80%, and much of the diagnosis centered on content that drove traffic but sat too far from the product.
That does not mean educational content is dead. It means a vague educational scale is a worse bet. Pages that still feel durable tend to sit closer to action: comparison pages, workflow content, calculators, implementation guides, templates, and niche content with actual domain expertise.
Content-model decision table
| Content model | Exposure level | Why | Recommended move |
| Broad TOFU library | High | Easy to summarize, weak click necessity | Consolidate and prune |
| Product-led education | Medium | Closer to action and workflow | Add proof and implementation detail |
| Expert-led niche content | Lower | Harder to compress into a generic answer | Expand depth and specificity |
| Comparison pages | Lower | Users still need evaluation | Add tradeoffs and decision criteria |
| Tools / calculators | Lower | Utility creates a reason to click | Build around high-value jobs |
Three named examples
HubSpot: down 70% to 80%. The lesson is not “never publish educational content.” The lesson is that the generic educational scale is no longer enough.
People.com: up 27%. Brand pull and destination intent still matter.
Men’s Journal: up 415%. That number is ridiculous, but it makes one thing clear: the channel did not collapse evenly.
📌 Audit step: If more than half of your organic sessions come from broad informational pages with weak product or commercial adjacency, stop scaling that model until you can prove it drives qualified pipeline or strong assisted conversions.
The positive exception
The data does not support the lazy “SEO is over” take. Search Engine Land said the top 10 sites still grew about 1.6%. We also cited People.com up 27% and Men’s Journal up 415%. If the whole channel had simply broken, those examples would not exist.
The better explanation is narrower. SEO still works where the user wants a destination, a decision, a workflow, or a brand. It weakens fastest where the click was optional in the first place.
Query-intent resilience table
| Query / asset type | Relative resilience | Why |
| Broad informational queries | Low | Easy to satisfy before the click |
| Branded queries | Higher | The user already wants the destination |
| Commercial investigation | Higher | Users still need comparison and evaluation |
| Utility tools / calculators | Higher | The SERP cannot fully replace the asset |
| Expert niche explainers | Medium-high | Specificity and trust still pull clicks |
✅ Quick takeaway: SEO still works where the click does real work. It weakens fastest where the click only used to.
What to do in the next 12 weeks
You do not need a grand reinvention first. You need sequence and discipline.
Decision matrix
| Your situation | First move | Second move | Avoid |
| Clicks down, impressions stable | Diagnose click compression | Split AIO and non-AIO queries | Panic rewrites |
| Non-branded down, branded stable | Rework content mix | Expand commercial pages | Publishing more generic TOFU |
| Traffic flat, pipeline weak | Improve conversion paths | Add product-led education | Chasing sessions for their own sake |
| Heavy AIO exposure | Track citation visibility | Build answer-resistant assets | Reporting only on rank |
| Mid-tier site pressure | Protect resilient pages | Prune weak informational content | Blanket sitewide changes |
| Paid costs rising | Recalculate payback by query class | Support only high-value gaps | Buying back low-intent traffic |
12-week plan
Days 1-30
Pull 12 months of Search Console data. Split branded and non-branded demand. Group pages by intent and by content model. Isolate the queries where clicks fell without the same drop in impressions.
Days 31-60
Consolidate overlapping informational pages. Upgrade the assets closest to revenue first. Add stronger evidence, clearer authorship, tables, examples, and decision support.
Days 61-90
Launch one benchmark asset, one calculator or template, and one ICP-specific workflow page. Replace traffic-only reporting with a wider scorecard. Add citation visibility and assisted conversions to the monthly review.
2026 organic traffic audit checklist
- Check clicks, impressions, CTR, and average position by query type.
- Split branded and non-branded performance.
- Group pages by intent bucket.
- Tag pages by content model.
- Separate AIO-exposed queries from non-AIO queries.
- Review whether more than half of traffic comes from weak-adjacency TOFU content.
- Add references and proof to pages you want cited.
- Track assisted conversions alongside sessions.
- Build one destination-grade asset the SERP cannot replace.
- Add a non-search hedge such as email, video, or community.
Red flags
- Sessions are still your only north-star metric.
- Your highest-traffic pages are generic explainers.
- You cannot split branded and non-branded demand quickly.
- You do not track citation visibility.
- Your roadmap underweights commercial pages.
- You are buying back low-intent traffic with paid without checking ROI.
- You have no owned-audience hedge outside search.
🧮 Audit task: Calculate Qualified Organic Efficiency=Qualified organic conversionsOrganic sessionsQualified Organic Efficiency=Organic sessionsQualified organic conversions. Then compare it against CTR by intent bucket. If CTR falls but efficiency rises, the channel may be getting smaller and better at the same time.
KPI changes that actually matter
Traffic still matters. It just does not deserve to sit alone at the top of the dashboard anymore. ALM Corp’s CTR data makes that obvious because rank and visibility can remain meaningful while click yield deteriorates.
KPI replacement table
| Old KPI | Why it misleads now | Better KPI |
| Organic sessions | Misses click compression | Qualified organic conversions |
| Average position | Rank can hold while CTR falls | CTR by intent bucket |
| Total clicks | Blends strong and weak demand | Assisted conversions |
| Content output | Rewards volume over usefulness | Citation visibility |
| Sitewide traffic growth | Hides segment-specific damage | Branded search lift |
If I were rebuilding the dashboard this quarter, I would use five views: qualified conversions, CTR by intent, branded search lift, assisted conversions, and citation visibility. The old traffic report is not useless. It is just incomplete in a much more dangerous way now.
📌 Action: Do not judge content refreshes only by recovered traffic. Judge them by conversion quality, assisted pipeline, and whether the page still gives the user a reason to click.
What happens next
The short-term trend looks clear enough. While aggregate search volume fluctuates, the underlying distribution of discovery is shifting toward proprietary chat interfaces – the latest gen ai traffic share data confirms that platform-specific referral quality now varies significantly by model. The gap between visibility and visits will probably keep widening unless SERP behavior changes materially. A market-level decline of 2.5% does not sound severe until you place it next to 60% zero-click behavior, rising AI Overview coverage, and weaker CTR both with and without AIOs.
The higher-confidence prediction is that reporting will change faster than content teams do. The lower-confidence prediction is that more verticals will start to look like today’s early-pressure categories. Real estate at 258%, restaurants at 273%, and retail at 206% AIO growth are not exactly subtle warning signs.
I also think a lot of teams will realize, a little too late, that much of their library content never had strong destination value in the first place. It only looked defensible because the old SERP used to pass the click through.
Conclusion
TL;DR:
- U.S. organic traffic was down 2.5% YoY.
- Zero-click searches reached 60%, with mobile at 77%.
- AI Overview appearance rose from 6.49% to 13.14%, and category-level presence reached 32.76% in ALM Corp’s data.
- Organic CTR fell to 0.61% with AIOs present versus 1.62% without them.
- The top 10 sites still grew about 1.6%, while mid-tier sites took the real pressure.
The simplest conclusion is this: the click got harder to earn. Not impossible. Not irrelevant. Just harder.
That is why the doom version of this story feels wrong, and the complacent version feels wrong too. Search still matters. SEO still matters. But the easy version of organic growth through a broad informational scale looks a lot weaker than it did even a year ago.
If you adapt around that reality, the next moves get clearer. Cut weak TOFU. Defend destination-grade assets. Measure the channel through intent and conversion quality, not just visits. Build pages and tools that do something a summary box cannot. That is the work now.
FAQ
Why is organic traffic down in 2026?
Search Engine Land reported U.S. organic traffic down 2.5% YoY in Graphite data, while other current studies point to more zero-click behavior and weaker CTR on AI-heavy results pages.
How much do AI Overviews hurt click-through rate?
ALM Corp reported organic CTR at 0.61% with AI Overviews present versus 1.62% without them. The Digital Bloom also cited a broader comparison of 8% clicks with AI summaries versus 15% without them.
Which sites are most exposed?
Search Engine Land said the sharpest declines hit sites ranked roughly between the top 100 and 10,000, while the top 10 sites grew about 1.6%. Mid-tier sites with heavy informational dependence look especially exposed.
Should B2B teams stop investing in SEO?
No. The same evidence base includes People.com up 27% and Men’s Journal up 415%, which means the channel has not collapsed evenly. The smarter move is to fund stronger asset types and stop treating broad informational scale as automatically safe.
What should teams change first?
Start with segmentation. Split branded and non-branded demand, separate AIO and non-AIO queries, and review content performance by intent and asset type before changing pages.
References
Statistical studies and benchmark data
https://searchengineland.com/organic-search-traffic-down-yoy-data-467748
https://almcorp.com/blog/paid-search-clicks-double-organic-clicks-fall-2026-data
https://searchengineland.com/paid-search-clicks-double-organic-clicks-fall-study-469519
Editorial analysis and report-style research
https://thedigitalbloom.com/learn/2025-organic-traffic-crisis-analysis-report/
https://thedigitalbloom.com/learn/google-ai-overviews-top-cited-domains-2025
https://quantikal.com/2026/01/27/organic-search-traffic-down-2-5-yoy-u-s/
https://blog.mean.ceo/startup-news-drop-in-organic-search-traffic-and-seo-blueprint-2026/
Commentary and practitioner discussion
https://growth-engines.com/insights/seo-aeo/b2b-pipeline-strategy-ai-geo-discovery
https://thegeocommunity.com/blogs/graphite-seo-traffic-hasnt-dramatically-declined