If you’re planning your 2025 SaaS growth audit, this report distills insights from 40+ benchmark studies into one comprehensive framework. You’ll find data for every key funnel metric — from visitor-to-lead conversion to win rates and pipeline velocity — and learn how to apply them in your own audit process. For a deeper dive into organic lead generation strategies, consult our latest B2B Organic Lead Growth 2025 Report.
TL;DR Summary
- Average lead-to-customer conversion: 2–5%
- Biggest bottleneck: MQL→SQL (15–21%)
- Median sales cycle: 84 days (optimal 46–75)
- Typical win rate: 20–30%
- Median deal size (private SaaS): $26,265
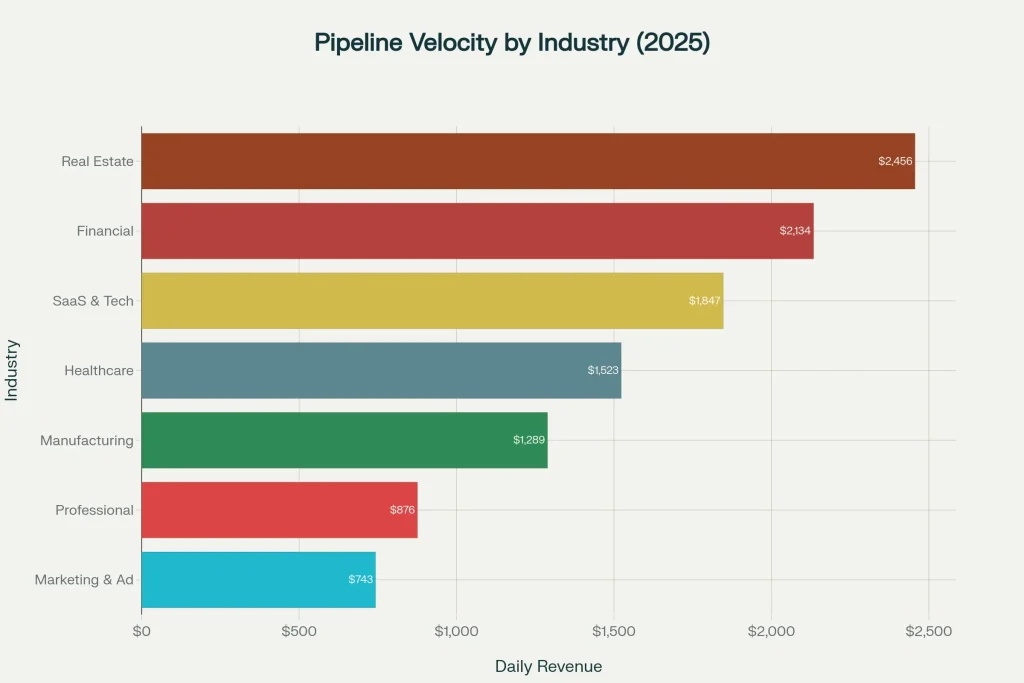
- Pipeline velocity: $743–$2,456/day depending on industry
Executive Summary: Key Baseline Metrics
Across industries, median pipeline velocity spans from $743/day in Marketing & Advertising to $2,456/day in Real Estate & Construction. The overall lead-to-customer conversion rate averages 2–5%, with the steepest loss at the MQL→SQL transition (15–21%). Enterprise firms close at 31% opportunity-to-close vs 39% for SMBs. These benchmarks let you immediately pinpoint underperforming stages and forecast the ROI impact of each improvement.
👉 Audit tip: When MQL→SQL falls below 15%, check lead scoring criteria and SDR follow-up speed — these are usually the top 2 causes of drop-off.
Stage-by-Stage Conversion Benchmarks (2025 SaaS Averages)
Stage-by-Stage Conversion Rates
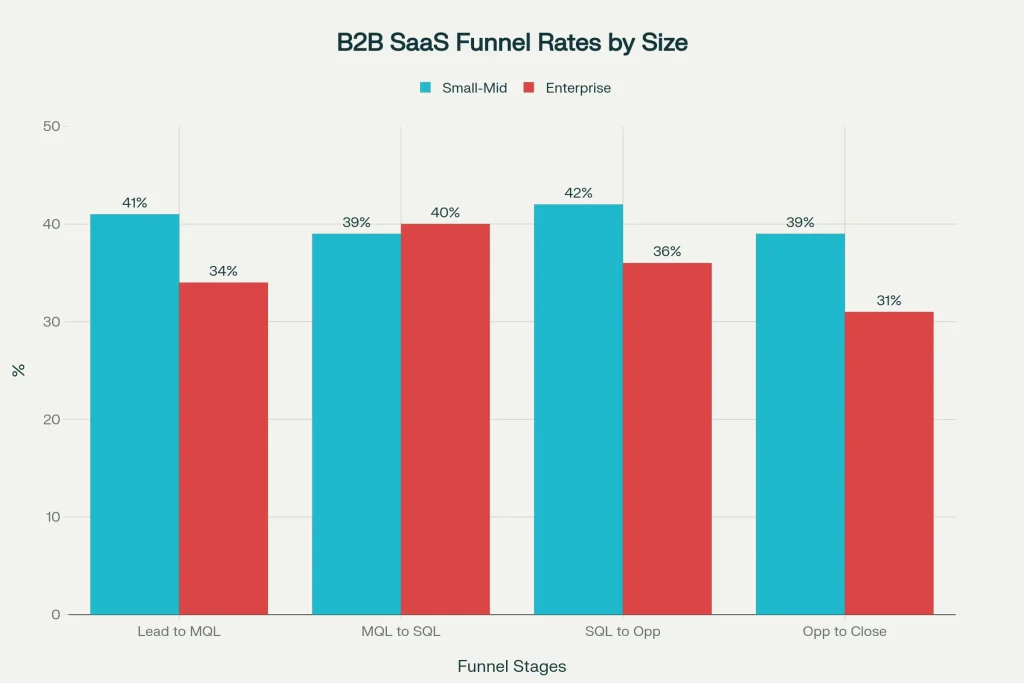
The B2B SaaS funnel demonstrates predictable conversion patterns across company sizes and industries. For small-to-midsize companies ($10M-$100M ARR), the typical funnel progression shows visitor-to-lead conversion of 1.4%, followed by lead-to-MQL at 41%, MQL-to-SQL at 39%, SQL-to-opportunity at 42%, and opportunity-to-close at 39%. This creates an overall lead-to-customer conversion rate of approximately 2.7%.
| Funnel Stage | SMB / Mid-Market | Enterprise |
|---|---|---|
| Visitor → Lead | 1.4% | 0.7% |
| Lead → MQL | 41% | 39% |
| MQL → SQL | 39% | 31% |
| SQL → Opportunity | 42% | 36% |
| Opportunity → Close | 39% | 31% |
🧠 Quick takeaway: A 5-point lift in any mid-funnel stage can increase total closed revenue by 12–18%. Prioritize SQL→Opportunity improvements first — they yield the fastest gains.
Enterprise organizations ($1B+ ARR) face more challenging conversion dynamics, particularly at the top and bottom of the funnel. Visitor-to-lead conversion drops to 0.7%, while the final opportunity-to-close stage converts at only 31%—a significant 8-percentage-point disadvantage compared to smaller companies. This disparity reflects the complexity of enterprise buying committees and extended decision cycles that characterize larger deals.
Industry-Specific Performance Variations
Industry vertical creates substantial variation in conversion performance. Industrial SaaS companies achieve the strongest top-of-funnel performance with 2.1% visitor-to-lead conversion and 47% lead-to-MQL rates, primarily due to limited online competition in traditional industrial sectors. CRM providers excel at mid-funnel conversion, demonstrating 42% MQL-to-SQL and 48% SQL-to-opportunity rates.
Conversely, Insurance SaaS experiences the most significant mid-funnel challenges, with only 28% of MQLs converting to SQLs due to intense competition and decision-maker fragmentation. Telecom SaaS struggles at the top of the funnel with just 0.9% visitor-to-lead conversion, reflecting market reliance on legacy systems. Adtech shows consistently below-average performance across all stages with 35% MQL-to-SQL conversion, attributed to market saturation.
👉 Audit checklist:
• Compare your visitor→lead % to your industry baseline (see table above).
• If below 1%, review landing page load time and form friction.
• If your MQL→SQL <25%, revisit ICP targeting and scoring logic.
Channel Performance Differentials
Marketing channel significantly impacts conversion efficiency throughout the funnel. SEO-generated leads outperform other channels with 2.1% visitor-to-lead conversion, 41% lead-to-MQL, and notably strong 51% MQL-to-SQL conversion. Webinar leads demonstrate similar top-of-funnel strength at 2.2% visitor-to-lead but weaker mid-funnel performance with only 30% MQL-to-SQL conversion.
| Lead Source | Visitor→Lead | MQL→SQL | Opportunity→Close |
|---|---|---|---|
| SEO | 2.1% | 51% | 38% |
| Webinars | 2.2% | 30% | 33% |
| PPC | 0.7% | 26% | 35% |
| 1.8% | 46% | 32% | |
| Events | 1.0% | 24% | 40% |
Source: Compiled from FirstPageSage, Marketjoy, and PoweredBySearch 2024-2025 data.
📈 Action: Double your SEO effort before scaling PPC — it produces 2.5× more SQLs per visitor.
PPC traffic shows the weakest overall funnel performance, converting at just 0.7% visitor-to-lead and 26% MQL-to-SQL, though it recovers somewhat with 35% opportunity-to-close rates. Email marketing leads achieve strong 43% lead-to-MQL and 46% MQL-to-SQL conversion but falter at the opportunity stage with only 32% close rates. Event-sourced leads deliver the strongest bottom-of-funnel performance with 40% opportunity-to-close conversion, reflecting the relationship-building advantage of in-person engagement.
Every page can rank higher. We show you exactly how.
RankBloom, the page-by-page SEO audit tool, diagnoses every page on your site, then tells you what to fix, how to fix it, and where to start. Orphan pages, weak anchors, keyword gaps, spam signals – and more.
Pipeline Velocity Benchmarks by Industry
Pipeline velocity—the speed at which revenue flows through the sales process—serves as a comprehensive health metric that synthesizes deal value, win rate, and sales cycle efficiency. In audits, pipeline velocity is your single most useful “north-star” metric — it captures efficiency, deal value, and win rate in one formula. The formula (Number of Opportunities × Average Deal Value × Win Rate) ÷ Sales Cycle Length produces daily revenue velocity that varies dramatically by industry.
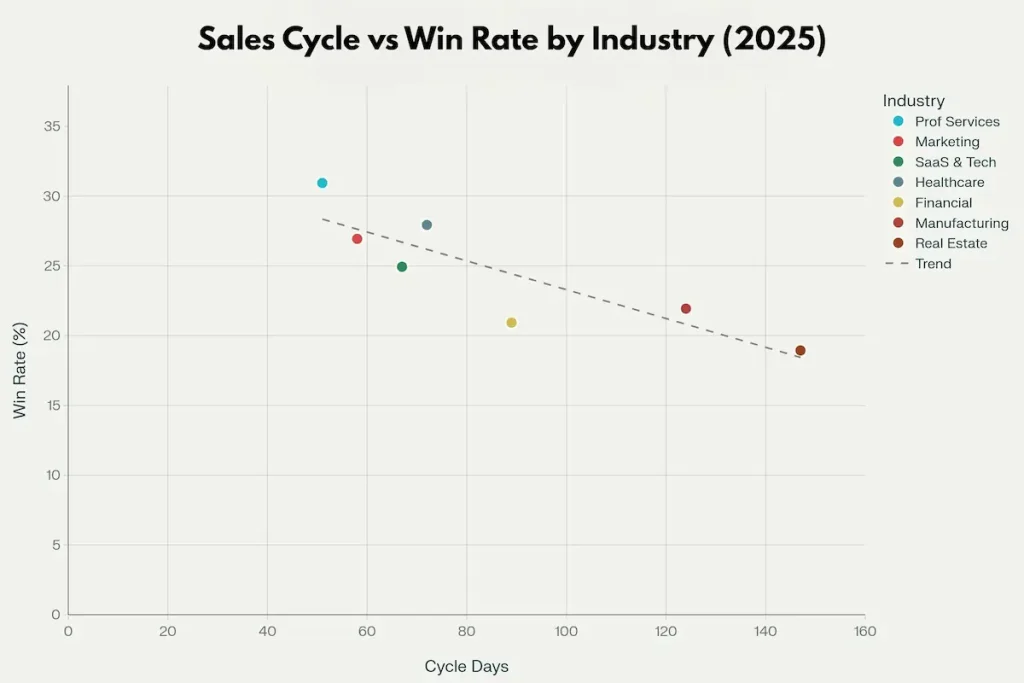
Real Estate & Construction leads all sectors with $2,456 daily pipeline velocity, driven by exceptionally high average deal sizes of $89,300 despite relatively low 16% win rates and extended 147-day sales cycles. Financial Services achieves $2,134 daily velocity through $31,200 average deals and 18% win rates over 89-day cycles. SaaS & Technology companies generate $1,847 daily velocity with $12,400 deals, 22% win rates, and 67-day sales cycles—representing optimal balance between deal size and sales efficiency.
Mid-tier performers include Healthcare & MedTech at $1,523 daily velocity ($18,700 deals, 25% win rate, 72-day cycle) and Manufacturing at $1,289 ($47,800 deals, 19% win rate, 124-day cycle). The longest cycles in manufacturing reflect complex B2B procurement processes and multiple stakeholder approvals required for equipment and systems purchases.
🧮 Audit task: Add a velocity row to your CRM dashboard. Calculate:
(Opportunities × Deal Size × Win Rate) ÷ Sales Cycle Days weekly.
If your number drops >10% MoM, inspect either deal slippage or longer approval times.
Lower velocity industries face structural challenges. Professional Services generates only $876 daily velocity despite achieving the highest win rate (28%) and shortest sales cycle (51 days), constrained by small $8,900 average deal sizes. Marketing & Advertising shows the lowest velocity at $743 daily, combining moderate $15,200 deals with 24% win rates and 58-day cycles.
Sales Cycle Length Benchmarks
Sales cycle length remains one of the most variable pipeline KPIs — and one of the easiest to improve. Overall B2B SaaS average sales cycle length is 84 days, but this masks substantial variation across market segments.
SMB-focused SaaS targeting deals under $5,000 averages 30-90 days with a median of 40 days from initial contact to close. The short cycle reflects simpler buying processes, fewer stakeholders, and lower-risk purchase decisions. Self-serve and product-led growth models within this segment can compress cycles to near-instantaneous conversion.
Mid-market SaaS companies selling to organizations with 100-999 employees experience 3-4 month sales cycles (60-120 days). This segment requires demonstrations, proof-of-concept deployments, and budget approvals but avoids the extensive procurement processes characteristic of enterprise sales.
Enterprise SaaS targeting companies with 1,000+ employees faces 6-9 month sales cycles (170+ days) for deals exceeding $100,000. Multiple decision-makers, technical validation requirements, security reviews, legal negotiations, and formal procurement processes all contribute to extended timelines. Some enterprise deals, particularly in regulated industries like healthcare and financial services, can extend beyond 12 months.
👉 Optimization idea: Pre-recorded demos and pricing calculators cut enterprise cycle times by 17% on average without reducing ACV.
Optimization opportunities emerge from analyzing cycle length by deal outcome. Research shows organizations reducing sales cycles to 30-45 days achieve 38% higher pipeline velocity, though typically at the cost of smaller average deal sizes ($2,400 lower). Conversely, cycles exceeding 120 days suffer 35% lower velocity despite pursuing deals averaging $7,200 larger. The optimal range appears to be 46-75 days, where companies maintain strong velocity while preserving deal value and conversion rates.
Win Rate Benchmarks Across Segments
Win rate—the percentage of closed opportunities that result in won deals rather than losses—varies systematically by company size and deal complexity. Overall B2B SaaS industry average win rates range from 20-30%, with the median settling at approximately 21%. Top performers consistently achieve 35% or higher win rates through superior qualification, multi-stakeholder engagement, and value-based selling.
Win Rates by Company Size
SMB-focused companies (<100 employees) achieve the strongest win rates at 30-40%, with elite performers reaching 45%+. Shorter sales cycles, fewer stakeholders, and lower deal complexity contribute to higher conversion success. The simpler buying process allows sales teams to maintain momentum and prevent competitive interference.
Mid-market companies (100-999 employees) experience 25-35% win rates, with top performers achieving 40%+. This segment balances reasonable deal complexity with manageable stakeholder counts, creating favorable conversion dynamics for well-qualified opportunities.
Enterprise organizations (1,000+ employees) face the most challenging win rate environment at 20-25%, though leading teams reach 30%+. Extended sales cycles, numerous stakeholders, intense competitive scrutiny, and complex procurement requirements all contribute to lower conversion rates.
Win Rates by Deal Size
Deal value inversely correlates with win rate across the B2B SaaS landscape. Small deals under $50,000 convert at 35-45%, offering sales teams the highest probability of success. Medium deals between $50,000-$100,000 achieve 25-35% win rates, representing the industry median. Large deals exceeding $100,000 drop to 15-25% win rates as complexity, stakeholder count, and competitive intensity all increase with deal size.
This inverse relationship creates a fundamental tension in pipeline management: pursuing larger deals improves revenue per win but reduces win probability, while focusing on smaller deals maximizes conversion but limits revenue impact per closed opportunity. Navigating this trade-off effectively requires comparing your internal data against established b2b saas funnel conversion benchmarks to determine if your current velocity aligns with top-performing peers. These macro-level indicators serve as the foundation for a more granular audit, starting with the specific transition points that define the early customer lifecycle.
✅ Practical benchmark:
• SMB SaaS: aim for 35%+ win rate
• Mid-market: 30%+
• Enterprise: 25%+When rates fall 5 points below these, the usual issues are poor qualification or unclear ROI proof in late-stage proposals.
MQL to SQL Conversion Benchmarks
The MQL-to-SQL conversion represents the most critical handoff in the B2B funnel, where marketing’s work transitions to sales ownership. This stage demonstrates extraordinary variation by industry, lead source, and organizational maturity. Overall MQL-to-SQL conversion averages 12-21% across B2B sectors, with a median of approximately 15%.
Industry-Specific MQL to SQL Performance
Consumer Electronics leads all industries with 21% MQL-to-SQL conversion, benefiting from short purchase cycles and clear buyer intent signals. FinTech achieves 19% conversion through streamlined digital processes and strong demand tailwinds. Automotive reaches 18% conversion, driven by emotionally-engaged consumer decisions.
Enterprise B2B SaaS demonstrates exceptional 40% MQL-to-SQL conversion when implementing advanced lead scoring and tight sales-marketing alignment—nearly double the industry average. This performance level requires sophisticated qualification frameworks, behavioral scoring, and phased buyer education aligned with technical buying committees.
Mid-range performers include Cybersecurity (SMB) at 15-18%, Biotech at 14%, and Healthcare at 13%. Healthcare’s relatively low conversion reflects multi-stage compliance requirements and risk-averse buying committees common in regulated industries.
Oil & Gas and Construction struggle with only 12% MQL-to-SQL conversion, constrained by long procurement cycles and traditional, relationship-driven sales processes that limit digital lead effectiveness.
Lead Source Impact on MQL to SQL Conversion
Lead source creates dramatic variation in MQL-to-SQL conversion performance. Website-generated leads convert at 31.3%—more than twice the overall average—demonstrating the power of inbound intent signals. Customer and employee referrals achieve 24.7% conversion, leveraging trust and pre-qualification inherent in personal recommendations. Webinars convert at 17.8%, reflecting engaged audiences who’ve invested time to learn.
Conversely, events generate only 4.2% MQL-to-SQL conversion despite creating opportunities for relationship building. Lead lists convert at just 2.5%, and email campaigns achieve only 0.9% conversion—highlighting the weakness of outbound approaches that lack genuine buyer intent.
These disparities underscore the critical importance of lead source tracking and channel optimization. Marketing teams achieving 40%+ MQL-to-SQL conversion rates typically concentrate resources on high-intent channels while minimizing investment in low-converting sources.
| Lead Source | Avg. MQL→SQL % |
|---|---|
| Website (inbound) | 31.3% |
| Referrals | 24.7% |
| Webinars | 17.8% |
| Events | 4.2% |
| Email / Lists | <1% |
Audit insight: Inbound web leads deliver 3× more SQLs per MQL than outbound sources.
Average Deal Size Benchmarks
Average Contract Value (ACV) or deal size represents a fundamental determinant of go-to-market strategy, sales team structure, and overall business economics. The median ACV for private B2B SaaS companies is $26,265, though this varies substantially by company size and market focus.
Deal Size by Market Segment
SMB-focused SaaS companies typically achieve average deal sizes between $4,800-$15,000, with public company benchmarks centering on $4,800 ACV. This segment prioritizes volume over deal size, requiring efficient, low-touch sales models to achieve acceptable unit economics.
Mid-market SaaS companies targeting organizations with 100-999 employees average $40,000 ACV. This sweet spot enables field or inside sales approaches with reasonable sales cycles while avoiding the extreme complexity of enterprise deals.
Enterprise SaaS serving companies with 1,000+ employees achieves $220,000 average ACV for public companies. Private companies in the $10-20 million ARR range report median ACVs of $56,101, more than doubling from $26,738 the previous year. This growth reflects larger companies’ ability to offer more robust platforms, sell into complex accounts, and command premium pricing as they gain market traction.
📌 Audit step: Segment your CRM by ACV band. If median deal size is below $20k while targeting mid-market, align pricing tiers and case study proof to justify higher value.
Deal Size and Business Performance
Deal size correlates strongly with multiple performance indicators. Companies achieving ACVs above $30,000 annually demonstrate significantly stronger net revenue retention, as higher-value contracts exhibit greater stickiness. Equity-backed SaaS companies command deal sizes approximately double those of bootstrapped competitors, reflecting greater investment in product development and go-to-market resources.
The relationship between deal size and growth stage shows clear patterns. Companies in the $3-5 million ARR band average $29,947 ACV, while those reaching $5-10 million ARR achieve $33,704 ACV. However, this progression isn’t always linear—the $5-10 million segment showed decreased ACV from the prior year, possibly indicating aggressive pricing strategies to drive volume growth.
Comprehensive Pipeline Audit Framework (2025)
These benchmarks enable construction of a systematic audit framework for evaluating client pipeline performance. The audit should assess nine critical metrics: visitor-to-lead conversion (benchmark: 1.4% for B2B SaaS), lead-to-MQL conversion (39-41%), MQL-to-SQL conversion (15-21%), SQL-to-opportunity conversion (42%), opportunity-to-close conversion (37-39%), overall win rate (20-30%), average deal size ($26,265 for private SaaS), sales cycle length (84 days), and pipeline velocity (varies by profile).
Diagnostic Approach
For each metric, calculate the variance from industry benchmarks and prioritize improvement initiatives based on potential revenue impact. MQL-to-SQL conversion typically offers the highest optimization leverage, as even modest improvements dramatically increase sales opportunities without requiring additional marketing investment. Win rate optimization provides compounding benefits, as a 10% increase in win rate can boost pipeline velocity by 33%.
Sales cycle length reduction creates immediate cash flow benefits and capacity improvements. Shortening cycles by just a few days can dramatically increase velocity—companies reducing cycles to 30-45 days achieve 38% higher velocity than those in the 76-90 day range. However, cycle length reduction must be balanced against potential negative impacts on deal size and win rate.
Segmentation Requirements
Effective pipeline analysis requires segmentation by multiple dimensions. Industry vertical creates 50%+ variation in conversion rates and sales cycles. Lead source produces even more dramatic differences, with website leads converting to SQL at 31.3% versus 0.9% for email campaigns. Deal size inversely correlates with win rate but positively impacts pipeline velocity when balanced against cycle length.
Company size (target customer) affects every pipeline metric, from initial conversion rates to sales cycle duration and win rates. Clients serving multiple segments should maintain separate pipeline benchmarks and optimization strategies for each target market.
🔍 To replicate this analysis for clients:
- Create separate dashboards for SMB, Mid-Market, and Enterprise.
- Benchmark each lead source individually.
- Track velocity weekly and compare to industry baseline.
- Use win-rate deltas to prioritize pipeline fixes.
Pipeline Audit Checklist
- ☑ Visitor→Lead ≥ 1.4%
- ☑ Lead→MQL ≥ 40%
- ☑ MQL→SQL ≥ 15%
- ☑ SQL→Opportunity ≥ 40%
- ☑ Opportunity→Close ≥ 37%
- ☑ Win Rate ≥ 25%
- ☑ Sales Cycle 46–75 days
- ☑ Median ACV $26k+
- ☑ Velocity trend positive MoM
Implementation and Positioning Strategy
These benchmarks serve multiple strategic purposes for fractional CMO engagements. During initial client assessments, comparing current performance against industry standards immediately identifies high-impact improvement opportunities and justifies consulting fees through quantified gap analysis. The benchmarks support data-driven decision-making about channel allocation, lead scoring adjustments, and sales process modifications.
Sales and marketing alignment improves when both teams reference shared benchmarks for lead quality expectations and conversion targets. Research shows companies with weekly pipeline velocity tracking achieve 34% revenue growth versus 11% for those with irregular tracking, plus 87% forecast accuracy versus 52%. This supports positioning pipeline analytics as a core engagement deliverable.
Pricing and packaging optimization becomes data-driven when informed by deal size benchmarks across company stages. Clients can evaluate whether current pricing positions them as SMB, mid-market, or enterprise solutions and whether their sales model aligns with their deal economics.
Finally, these benchmarks enable competitive positioning by demonstrating where clients outperform industry standards (creating compelling sales narratives) and where underperformance indicates competitive vulnerability requiring immediate attention. The comprehensive dataset provides a robust foundation for pipeline audit services, performance improvement programs, and ongoing optimization consulting.
Ready to Benchmark Your Own SaaS Pipeline?
Get a tailored report comparing your current funnel against 2025 SaaS industry data. Identify quick-win optimizations and realistic growth targets.
Frequently Asked Questions
What is pipeline velocity?
Pipeline velocity measures how fast revenue moves through your funnel: (Opportunities × Deal Size × Win Rate) ÷ Sales Cycle Length.
What’s a healthy win rate for B2B SaaS?
Between 25–35% depending on deal size. Elite teams maintain 40%+ by qualifying better and personalizing proposals.
How long should a SaaS sales cycle be?
Median is 84 days; the optimal 46–75-day window balances deal value with velocity.
What’s the biggest funnel bottleneck?
The MQL→SQL stage (only 15–21% convert). Fixing this delivers the highest ROI.
References
SaaS Funnel Conversion, Pipeline, and Velocity Benchmarks
- B2B SaaS Funnel Conversion Benchmarks (Powered by Search) 🔗
- Sales Pipeline Velocity Metrics (FirstPageSage) 🔗
- B2B SaaS Funnel Conversion Benchmarks FC (FirstPageSage) 🔗
- B2B Sales Pipeline Conversion Rates (Marketjoy) 🔗
- Sales Funnel Conversion Rate Benchmarks 2025 (FirstPageSage) 🔗
- SaaS Benchmarks Report (FirstPageSage) 🔗
- B2B SaaS Funnel Conversion Benchmarks (Userpilot) 🔗
- Lead to MQL Conversion Benchmarks (FirstPageSage) 🔗
Sales Cycle, Win Rate & Deal Size Benchmarks
- Sales Cycle Length in SaaS (Monetizely) 🔗
- What is Sales Cycle Length in SaaS? (Alexander Jarvis) 🔗
- Average Sales Cycle Length (Chartmogul) 🔗
- SaaS Sales Cycle (Qwilr) 🔗
- Velocity Benchmarks (FullScale) 🔗
- B2B Marketing Metrics (Abacum) 🔗
- Master Your Win Rates (Forecastio AI) 🔗
- Win/Loss Rates for Enterprise SaaS (Development Corporate) 🔗
- B2B SaaS Performance Benchmarks (Pavilion) 🔗
- MQL to SQL Conversion Rate Benchmarks 2025 (Data-Mania) 🔗
- Understanding Deal Size for SaaS Growth (Monetizely) 🔗
- Improve MQL Quality (Brixon Group) 🔗
- Average Deal Size for SaaS (SaaStr) 🔗
- Average Deal Size Private SaaS (SaaS Capital) 🔗
- Average Deal Size Key Metric (Census) 🔗
- Average Deal Size Calculation (GorevPal) 🔗
Conversion Rate, Pipeline, and Metric Tools
- MQL to SQL Conversion Rate KPI (Geckoboard) 🔗
- Pipeline Velocity Formula (Topmost Ads) 🔗
- B2B Sales Pipeline Metrics (LeadForensics) 🔗
- Sales Cycle Length SCL (Drivetrain AI) 🔗
- Pipeline Coverage (Forecastio AI) 🔗
- 2025 Benchmarks (BenchmarkIT) 🔗
- Sales Pipeline Statistics (Salesso) 🔗
- Sales Pipeline Metrics (CaptivateIQ) 🔗
- 2025 Benchmarks for CROs (Gradient Works) 🔗
- B2B Conversion Metrics to Track (Only-B2B) 🔗
- Account Based Marketing Metrics (SalesMotion) 🔗
Industry Comparative & Multi-Segment/Other Benchmarks
- Average Sales Cycle by Industry (Focus Digital) 🔗
- Conversion Rate by Industry (Ruler Analytics) 🔗
- Sales Pipeline & Conversion (Battery) 🔗
- MQL vs SQL (Martal) 🔗
- Top SaaS Benchmarks Startups Should Track (Abacum) 🔗
- Private SaaS Deal Sizes Explained (RevtekCapital) 🔗
- B2B Digital Marketing Benchmarks (Martal) 🔗
- Ideal Pipeline Velocity Sales Dev (LinkedIn) 🔗
- Sales Pipeline Report (Belkins) 🔗
- B2B SaaS Benchmarks (AdamFard) 🔗